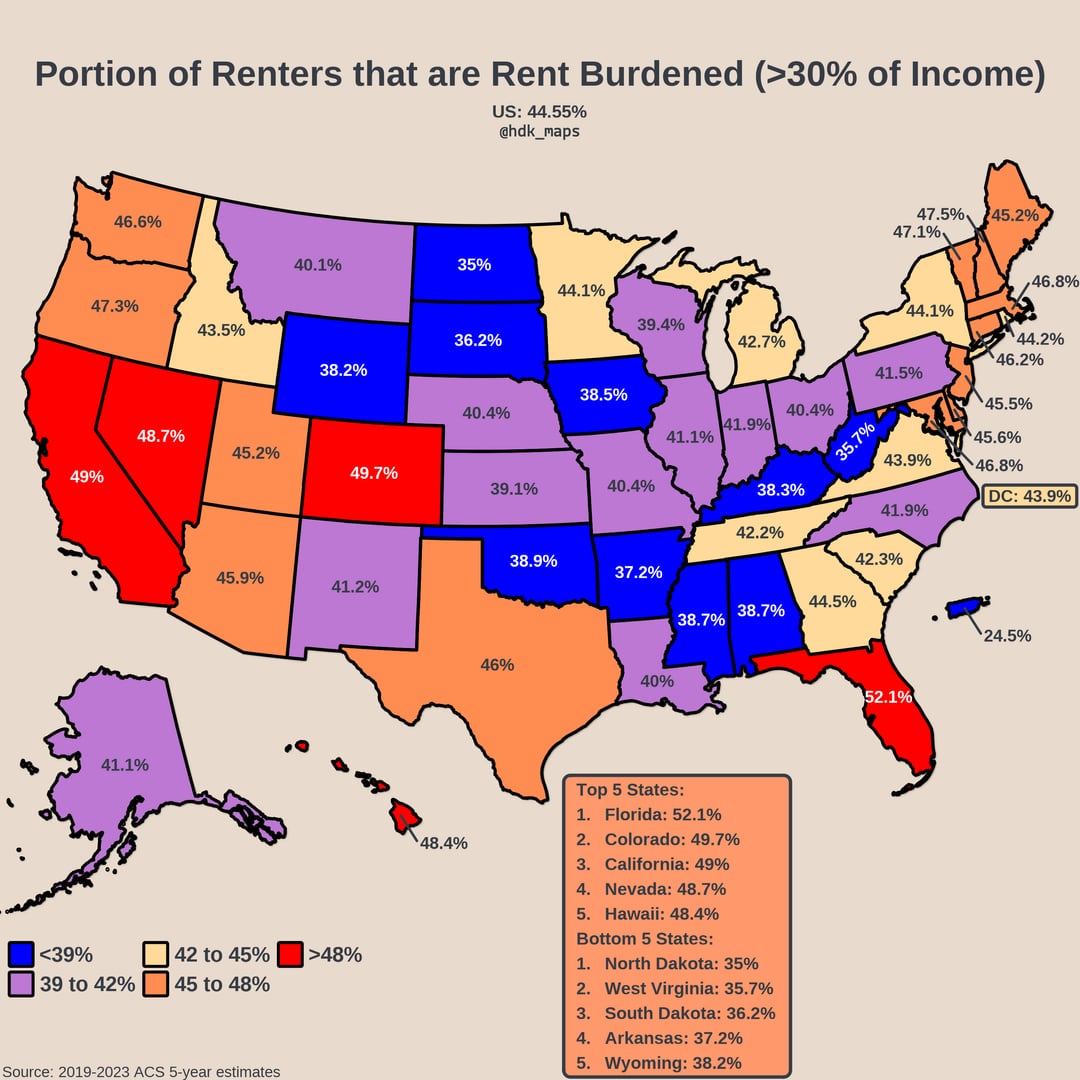
i knew florida was bad, but damn. at least we’re number one at something 😅
Data: American Community Survey accessed via API using tidycensus package in R
Tools: R
packages for data wrangling: dplyr, stringr
packages for mapping/shapefiles: colorspace, scales, sf, ggplot2, ggfx, grid, usmap, tigris (for PR shapefile)
packages for fonts: sysfonts, showtext
A few notes:
“Renters” refers to renter households which may be more than 1 person with more than 1 income. Renter households include single people, families, and unrelated individuals living together.
“Rent” refers to gross rent, which includes utilities (if paid separately), fees, etc.
Households with 0 or negative income are excluded from rent burden calculations by the Census Bureau. These people are likely living off of student loans or family transfers. Some may also be informally employed or self-employed people having a particularly bad year (negative incomes). Retirees tend not to be in this category as they will receive income from pensions, social security, and investment account withdrawals.
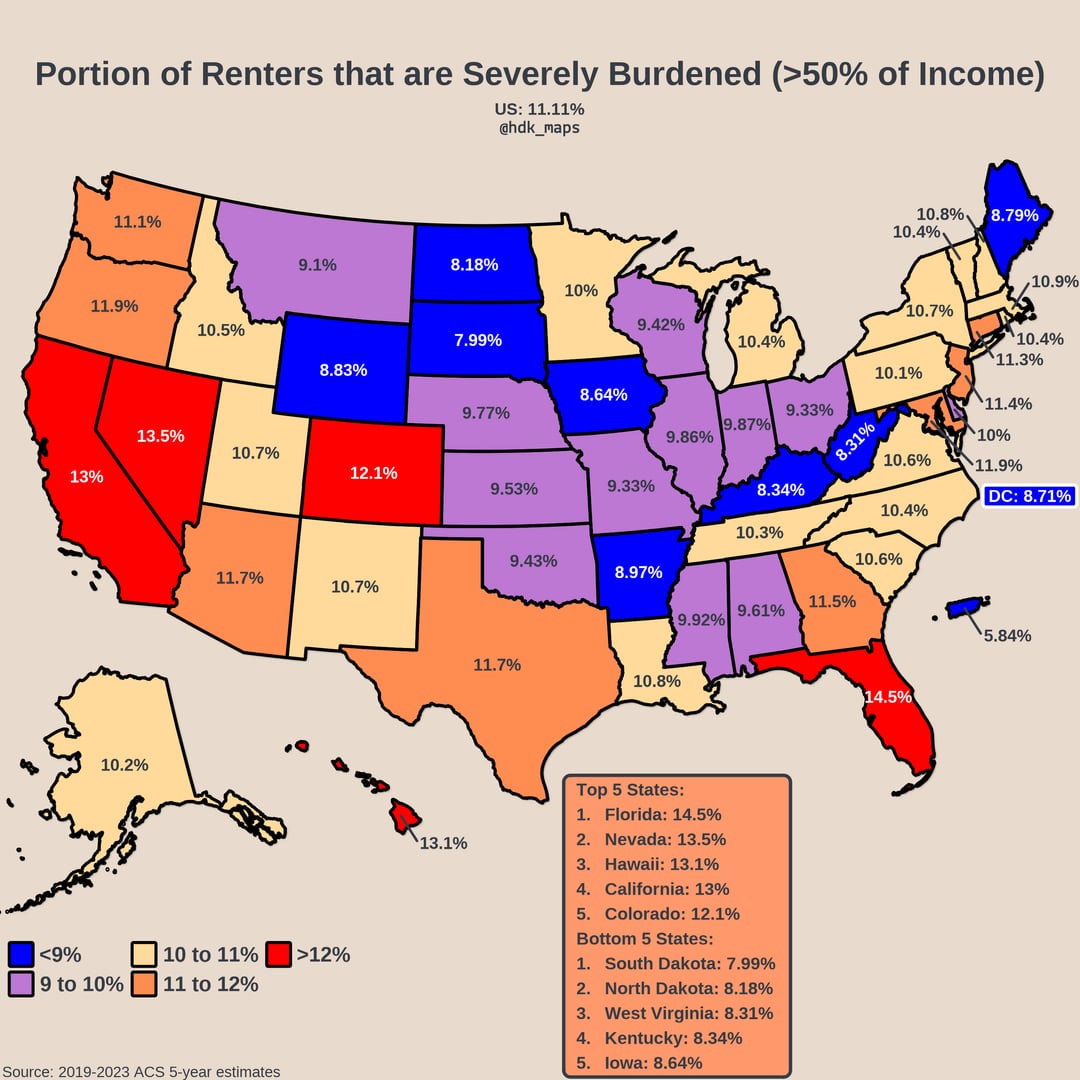
Interesting to see that Maine shifts from orange for Burdened to blue for Highly Burdened, where most of the states are around the same for both categories.
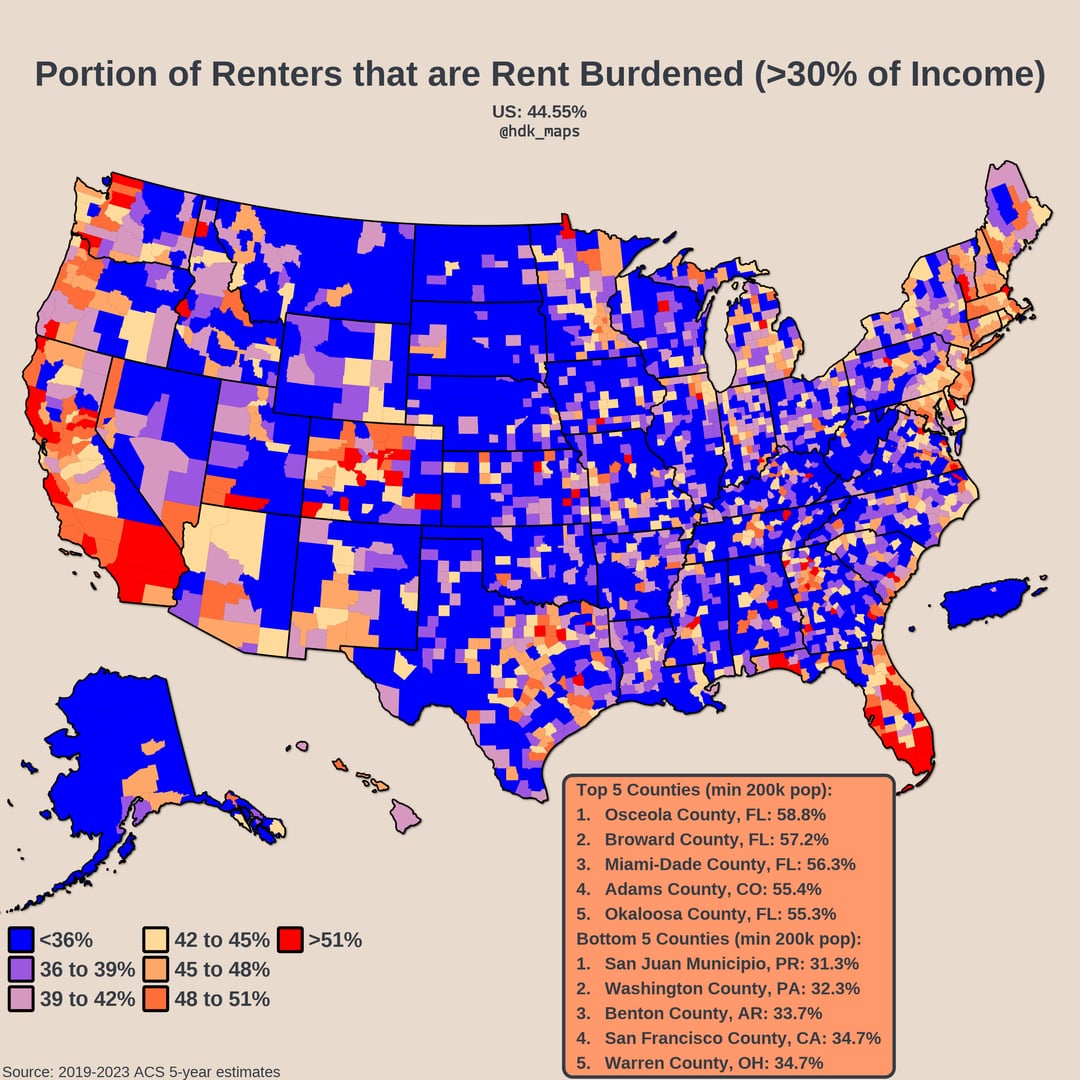
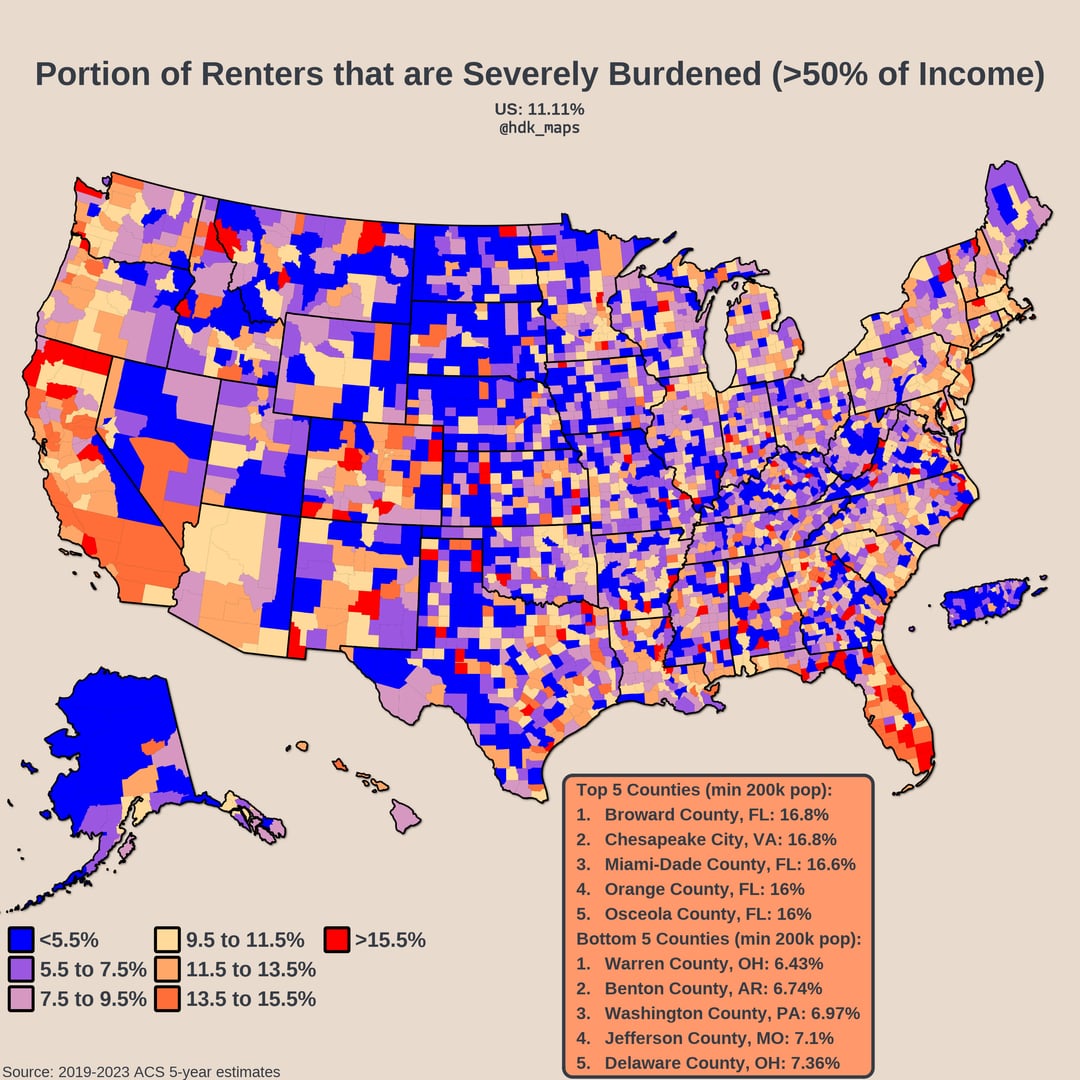
State and county data perhaps less interesting than city data would be for this, since you’re basically measuring density.
![[OC] Maps on Rent Burden in the US](https://www.europesays.com/wp-content/uploads/2025/09/aqkmu4shsirf1-1080x1024.jpg)
4 comments
i knew florida was bad, but damn. at least we’re number one at something 😅
Data: American Community Survey accessed via API using tidycensus package in R
Tools: R
packages for data wrangling: dplyr, stringr
packages for mapping/shapefiles: colorspace, scales, sf, ggplot2, ggfx, grid, usmap, tigris (for PR shapefile)
packages for fonts: sysfonts, showtext
A few notes:
“Renters” refers to renter households which may be more than 1 person with more than 1 income. Renter households include single people, families, and unrelated individuals living together.
“Rent” refers to gross rent, which includes utilities (if paid separately), fees, etc.
Households with 0 or negative income are excluded from rent burden calculations by the Census Bureau. These people are likely living off of student loans or family transfers. Some may also be informally employed or self-employed people having a particularly bad year (negative incomes). Retirees tend not to be in this category as they will receive income from pensions, social security, and investment account withdrawals.
Interesting to see that Maine shifts from orange for Burdened to blue for Highly Burdened, where most of the states are around the same for both categories.
State and county data perhaps less interesting than city data would be for this, since you’re basically measuring density.
Comments are closed.