![[OC] The US Homicide Rate is near a Record Low](https://www.europesays.com/wp-content/uploads/2025/09/n1s27il873sf1-1920x1024.png)
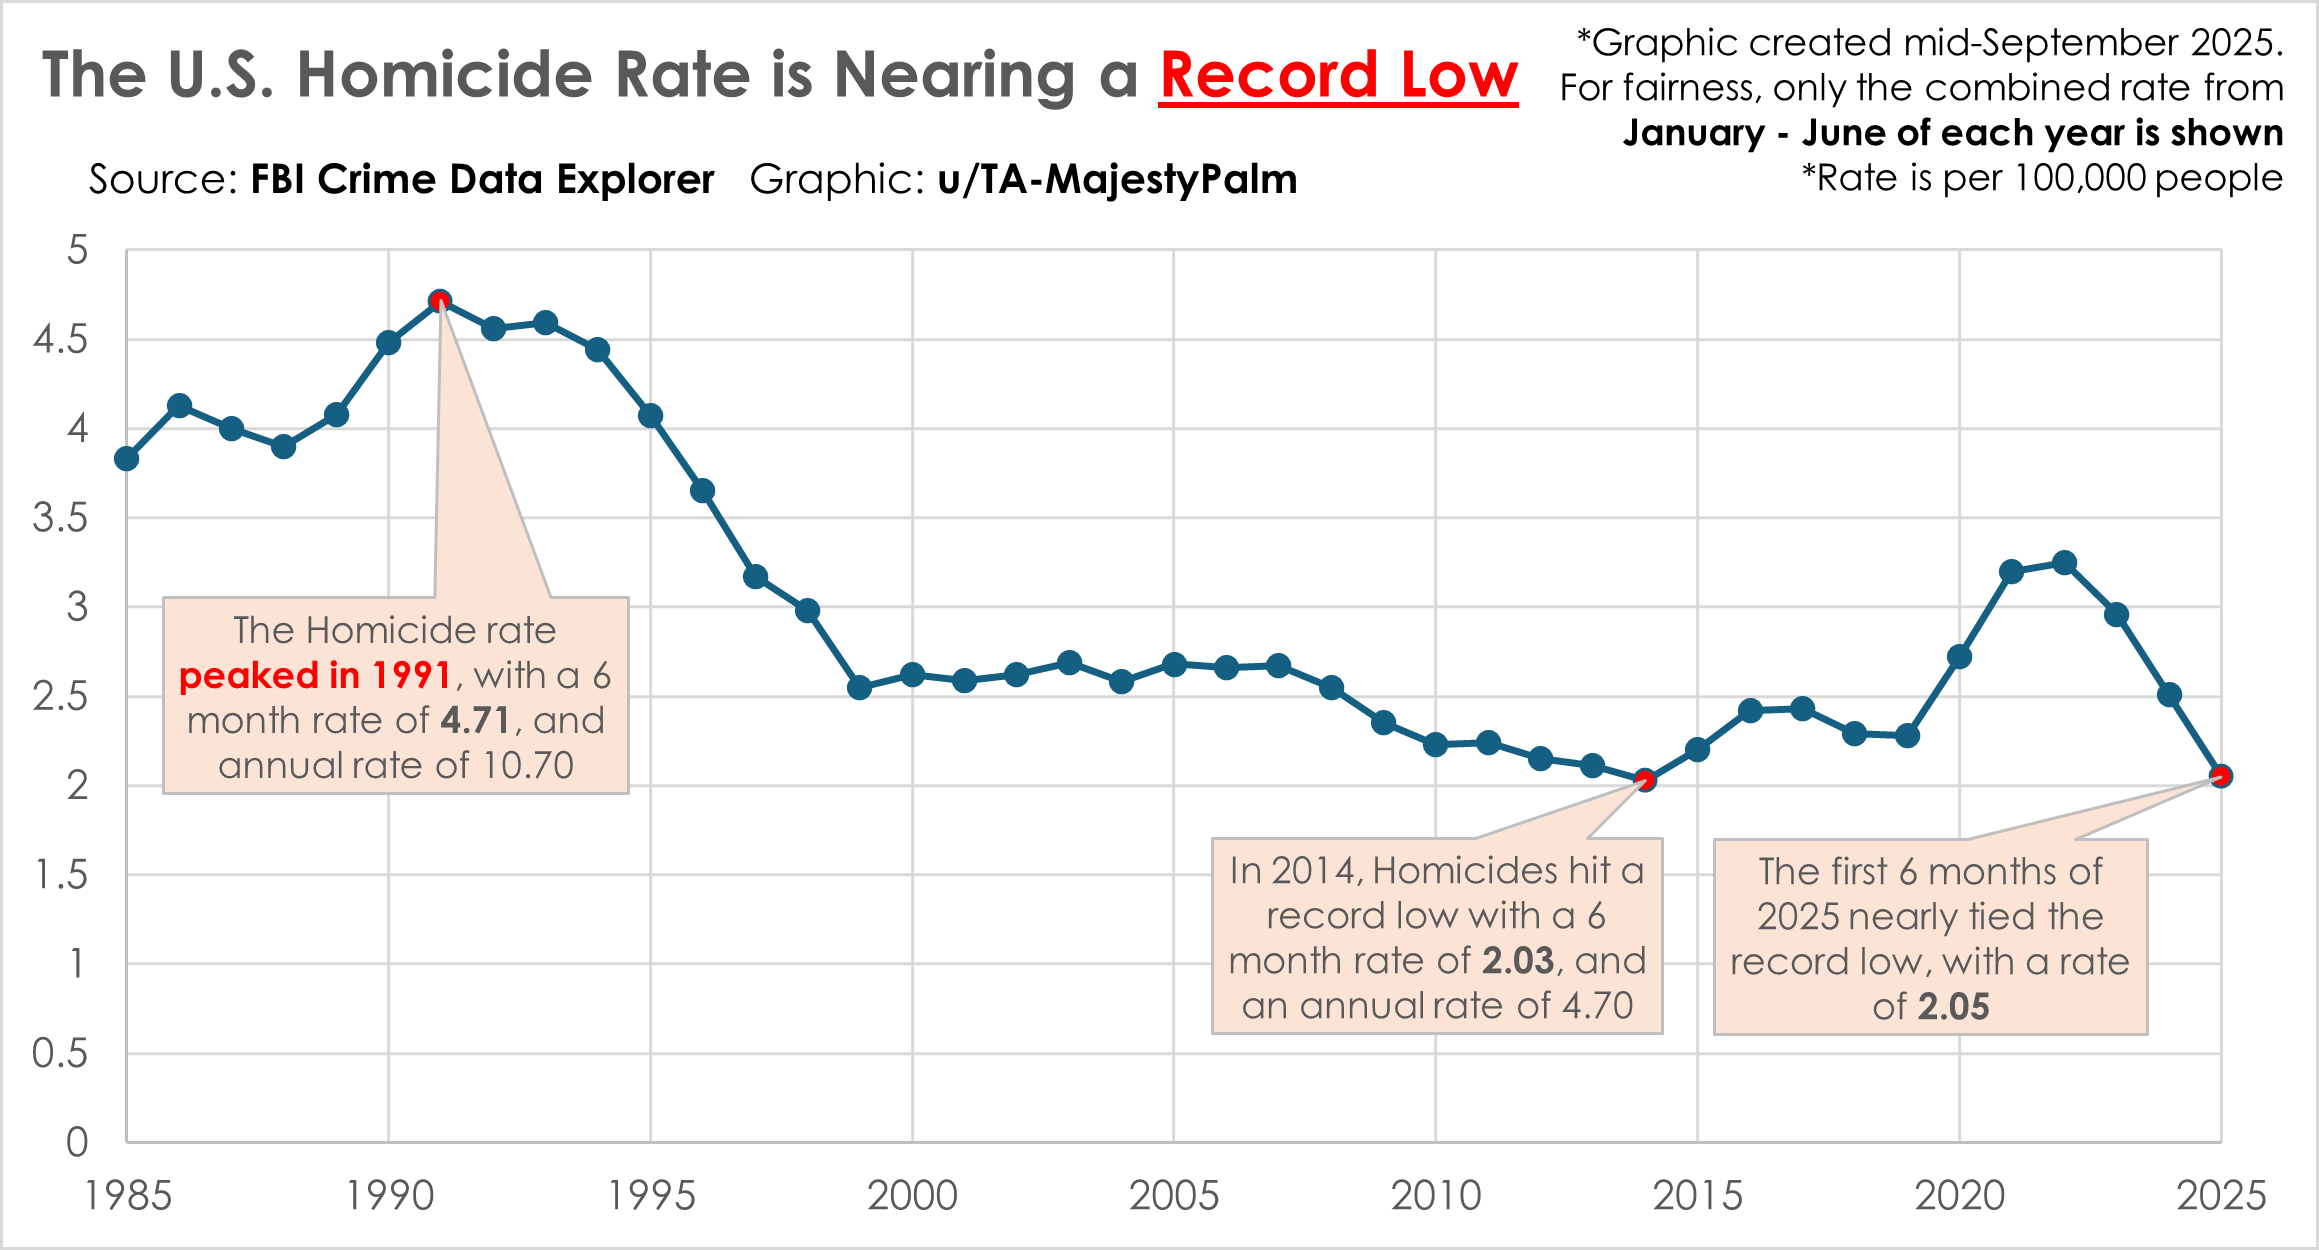
Graphic by me, created using the FBI Crime Data explorer here: https://cde.ucr.cjis.gov/LATEST/webapp/#/pages/explorer/crime/crime-trend
With the seemingly constant violence on the news, I wanted to explore how today's homicide rate actually compares historically.
Why show a 6 month (Jan-June) rate and not monthly or yearly?
-
I chose not to show yearly because 2025 is still in progress, but I still wanted to compare this year to previous years.
-
I chose not to show monthly as some departments only track this data annually – you can see this in the source data with a large spike in December each year.
-
I chose Jan-June to avoid any skew from "lagging data collection" over the most recent few months. You can again see this is happening in the source data – there is a huge drop off in August/September since some data collection is still in progress.
Here is a bonus yearly rate chart: keep in mind 2025 is skewed low due to incomplete data the last few months: https://www.consumershield.com/articles/murder-rate-by-year
Posted by TA-MajestyPalm
27 comments
Graphic by me, created using the FBI Crime Data explorer here: https://cde.ucr.cjis.gov/LATEST/webapp/#/pages/explorer/crime/crime-trend
With the seemingly constant violence on the news, I wanted to explore how today’s homicide rate actually compares historically.
Why show a 6 month (Jan-June) rate and not monthly or yearly?
– I chose not to show yearly because 2025 is still in progress, but I still wanted to compare this year to previous years.
– I chose not to show monthly as some departments only track this data annually – you can see this in the source data with a large spike in December each year.
– I chose Jan-June to avoid any skew from “lagging data collection” over the most recent few months. You can again see this is happening in the source data – there is a huge drop off in August/September since some data collection is still in progress.
So, the same 6 months are being compared for each year shown. Data not available prior to 1985.
Here is a bonus yearly rate chart (from a third party but also from FBI data): keep in mind 2025 is skewed low due to incomplete data the last few months: https://www.consumershield.com/articles/murder-rate-by-year
If only Republicans could read charts that undermine their belief system.
For reference:
UK – 0.95.
RemindMe! 1 year
Nice easy to read graph! Thank you for sharing
The US’s homicide rate is not down around 2 now, nor over the long term. 17k murders per year (what it was for much of the 2010s) for 340M people is a homicide rate of 5 per 100k.
example: [https://www.cdc.gov/nchs/fastats/homicide.htm](https://www.cdc.gov/nchs/fastats/homicide.htm)
Looks like you’ve not accounted for halving the stats period when you took Jan-Jun only. Double the numbers in your graph and it looks closer to the truth
(I also wouldn’t trust *any* stats from 2025 given how accountability in US government statistics has been openly eviscerated)
What’s really annoying is that if anybody on the right looks at this, they’ll point at the jump after 2020, and say it’s somehow Biden’s fault, rather than the fact of “Republicans get a lot more violent when they aren’t in charge”
What’s with the spike between 2019 and 2024? Covid related, I guess?
You seriously believe anything that comes from this MAGA government? This data is absolutely false.
Worth noting that almost all the change came in the 90s and as far as I’m aware while there are lots of theories no one is sure why?
I will say the 90’s in NY were wild.
Not everyone who’s shot also dies, usually a minority. Some heal completely, medicine is getting better, but many more are disabled or at least traumatized for their life. So people shot or stabbed says a lot more about violence than people died from being shot or stabbed.
The National Guard will fix this
Reference 2022/2023 annual homicide rates per 100 000 people for various countries:
Jamaica – 50
South Africa – 45
Haiti – 41
Mexico – 24.8
Nigeria – 21
Brazil – 20
Puerto Rico – 14
Ethiopia – 8.6
Russia – 6.8
US – 5.763
Cuba – 4.4
Pakistan – 4.3
Turkey – 3.2
India – 2.8
Canada – 2.273
Morocco – 1.7
France – 1.335
Sweden – 1.147
UK – 1.1
Australia – 0.853
Italy – 0.545
South Korea – 0.53
China – 0.5
Indonesia – 0.3
Japan – 0.233
So the annual rates should be around double of what’s being shown here?
I bet once the data completes for this year we’ll show a whole different trajectory
With all the deportations, I wonder if we will see a sharp drop. This would also be fun to find a correlation between country economic health
This is stupid. Stop praising him. Any country would have low crime rates if you have the military to police your civillians.
By the time hes out of power military goes back and crime shoots up again. Just so he can go and say “see the democrats is the cause of violence!” And people will believe him
That’s a good thing, a reason for all of us to be happy
Is Jan-June representative of the whole year? Aren’t most murders commited in the hottest months (July and August)?
And even that number is ten times the number in my eurpean country…
In 2025 is the FBI a valid data source?
Does anybody trust statistics from US federal agencies any more?
I like the graph but I think the info that it is for 6 months only of data each year is not prominent enough. But because it’s not “bad” colours nobody gives a fuck.
judging from past trends I suspect the direction will turn upward and drastically
I don’t have any proof to back this up, but I really think that precipitous drop in the 90s was a direct effect of legalized abortion after Roe v. Wade. With all the states banning abortion now I expect this rate to start increasing again in the next 15-20 years.
See the “lead-crime hypothesis” https://en.m.wikipedia.org/wiki/Lead%E2%80%93crime_hypothesis
That’s nice, but I’ve never lived in a neighborhood with excessive murder. Let’s see all of the crime, especially moving violations, along with penalties incurred.
Comments are closed.