Refinery News (global & domestic) Affects Markets
OPEC+ raises export quotas
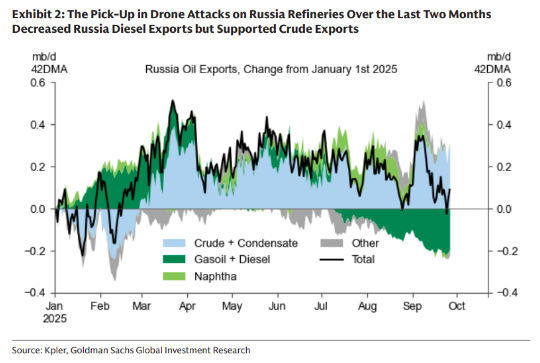
Ukrainian attacks have impacted Russian energy production
Refinery utilization rates should be monitored closely
U.S. LNG exports continue their streak
Sincerely,
David Thompson, CMT
Executive Vice President
Powerhouse
(202) 333-5380
The Matrix
Much of the recent talk in the petroleum trade press has focused on the OPEC+ decision to bring more oil to the market by increasing their production quotas. Many prominent banks have adopted a moderate to even slightly bearish outlook on crude oil prices over the next several months as a result.
While the price of crude oil is the primary driver of the price of refined products, current events highlight another important factor. Refineries can, at times, function as chokepoints in the global petroleum value chain.
Ukraine’s strategy of attacking Russian energy assets, and in particular, refineries, has led to a significant decline in Russia’s operable capacity. This, in turn, has led to two spillover effects. Because of domestic shortages, a partial ban of diesel exports has been enacted. At the same time, crude oil exports have increased (despite existing sanctions).
In the U.S., refinery maintenance season is underway. Five weeks ago, domestic refineries were operating at 96.6% of capacity. Today’s statistics reveal that figure has dropped to 91.4% of capacity.
The market has responded to these developments with continuing strength in both diesel and gasoline crack spreads. High margins should incentivize refiners currently in turnaround to return to elevated run rates as they restart. This may dovetail with the seasonal pattern of whole RBOB futures price making a seasonal low in the first part of November. Gasoline marketers should be preparing now to deploy protective hedges for their Q1 & Q2 2026 retail margins.
Supply/Demand Balances
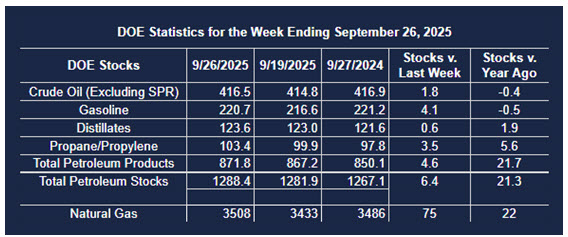
Supply/demand data in the United States for the week ending September 26, 2025, were released by the Energy Information Administration.
Total commercial stocks of petroleum increased (⬆) 7.2 million barrels to 1.2884 billion barrels during the week ending September 26th, 2025.
Commercial crude oil supplies in the United States were higher (⬆) by 1.8 million barrels from the previous report week to 416.5 million barrels.
Crude oil inventory changes by PAD District:
PADD 1: Down (⬇) 1.0 million barrels to 7.0 million barrels
PADD 2: Down (⬇) 1.6 million barrels to 101.6 million barrels
PADD 3: Up (⬆) 4.0 million barrels to 238.3 million barrels
PADD 4: Up (⬆) 0.1 million barrels to 22.8 million barrels
PADD 5: Up (⬆) 0.3 million barrels to 46.8 million barrels
Cushing, Oklahoma, inventories were down (⬇) 0.2 million barrels to 23.5 million barrels.
Domestic crude oil production increased (⬆) 4,000 barrels per day from the previous report to 13.505 million barrels per day.
Crude oil imports averaged 5.833 million barrels per day, a daily decrease (⬇) of 662,000 barrels. Exports decreased (⬇) 733,000 barrels daily to 3.751 million barrels per day.
Refineries used 91.4 percent of capacity; a decrease (⬇) of 1.6 percent from the previous report week.
Crude oil inputs to refineries decreased (⬇) 308,000 barrels daily; there were 16.168 million barrels per day of crude oil run to facilities. Gross inputs, which include blending stocks, decreased (⬇) 282,000 barrels daily to 16.604 million barrels daily.
Total petroleum product inventories increased (⬆) by 4.1 million barrels from the previous report week, up to 871.9 million barrels.
Total product demand decreased (⬇) 627,000 barrels daily to 20.166 million barrels per day.
Gasoline stocks increased (⬆) 4.1 million barrels from the previous report week; total stocks are 220.7 million barrels.
Demand for gasoline decreased (⬇) 440,000 barrels per day to 8.518 million barrels per day.
Distillate fuel oil stocks increased (⬆) 0.6 million barrels from the previous report week; distillate stocks are at 123.6 million barrels. EIA reported national distillate demand at 3.617 million barrels per day during the report week, a decrease (⬇) of 121,000 barrels daily.
Propane stocks rose (⬆) 3.5 million barrels from the previous report to 103.4 million barrels. The report estimated current demand at 534,000 barrels per day, a decrease (⬇) of 361,000 barrels daily from the previous report week.
Natural Gas
U.S. LNG set a second consecutive monthly record in September moving 9.4 million metric tons offshore, toping last month’s 9.3 million MT. This came despite an unplanned shutdown at the country’s largest export facility, Sabine Pass.
Europe was the most favored destination taking nearly two-thirds of U.S. exports, nearly four times as much as Asia.
According to the EIA:
Net injections into storage totaled 75 Bcf for the week ending September 19, compared with the five-year (2020–24) average net injections of 76 billion cubic feet (Bcf) and last year’s net injections of 49 Bcf during the same week. Working natural gas stocks totaled 3,508 Bcf, which is 203 Bcf (6%) more than the five-year average and 22 Bcf (1%) more than last year at this time.
The average rate of injections into storage is 18% higher than the five-year average so far in the refill season (April through October). If the rate of injections into storage matched the five-year average of 10.7 Bcf/d for the remainder of the refill season, the total inventory would be 3,956 Bcf on October 31, which is 203 Bcf higher than the five-year average of 3,753 Bcf for that time of year.
Was this helpful? We’d like your feedback.
Please respond to [email protected]
This material has been prepared by a sales or trading employee or agent of Powerhouse Brokers, LLC and is, or is in the nature of, a solicitation. This material is not a research report prepared by Powerhouse Brokers, LLC. By accepting this communication, you agree that you are an experienced user of the futures markets, capable of making independent trading decisions, and agree that you are not, and will not, rely solely on this communication in making trading decisions.
DISTRIBUTION IN SOME JURISDICTIONS MAY BE PROHIBITED OR RESTRICTED BY LAW. PERSONS IN POSSESSION OF THIS COMMUNICATION INDIRECTLY SHOULD INFORM THEMSELVES ABOUT AND OBSERVE ANY SUCH PROHIBITION OR RESTRICTIONS. TO THE EXTENT THAT YOU HAVE RECEIVED THIS COMMUNICATION INDIRECTLY AND SOLICITATIONS ARE PROHIBITED IN YOUR JURISDICTION WITHOUT REGISTRATION, THE MARKET COMMENTARY IN THIS COMMUNICATION SHOULD NOT BE CONSIDERED A SOLICITATION.
The risk of loss in trading futures and/or options is substantial and each investor and/or trader must consider whether this is a suitable investment. Past performance, whether actual or indicated by simulated historical tests of strategies, is not indicative of future results. Trading advice is based on information taken from trades and statistical services and other sources that Powerhouse Brokers, LLC believes are reliable. We do not guarantee that such information is accurate or complete and it should not be relied upon as such. Trading advice reflects our good faith judgment at a specific time and is subject to change without notice. There is no guarantee that the advice we give will result in profitable trades.
Copyright 2025 Powerhouse Brokers, LLC, All rights reserved