![[OC] Hourly Mean Wage for Home Health and Personal Care Aides by U.S. State (2024)](https://www.europesays.com/wp-content/uploads/2025/10/7s3hw5dkqzsf1-1920x1024.png)
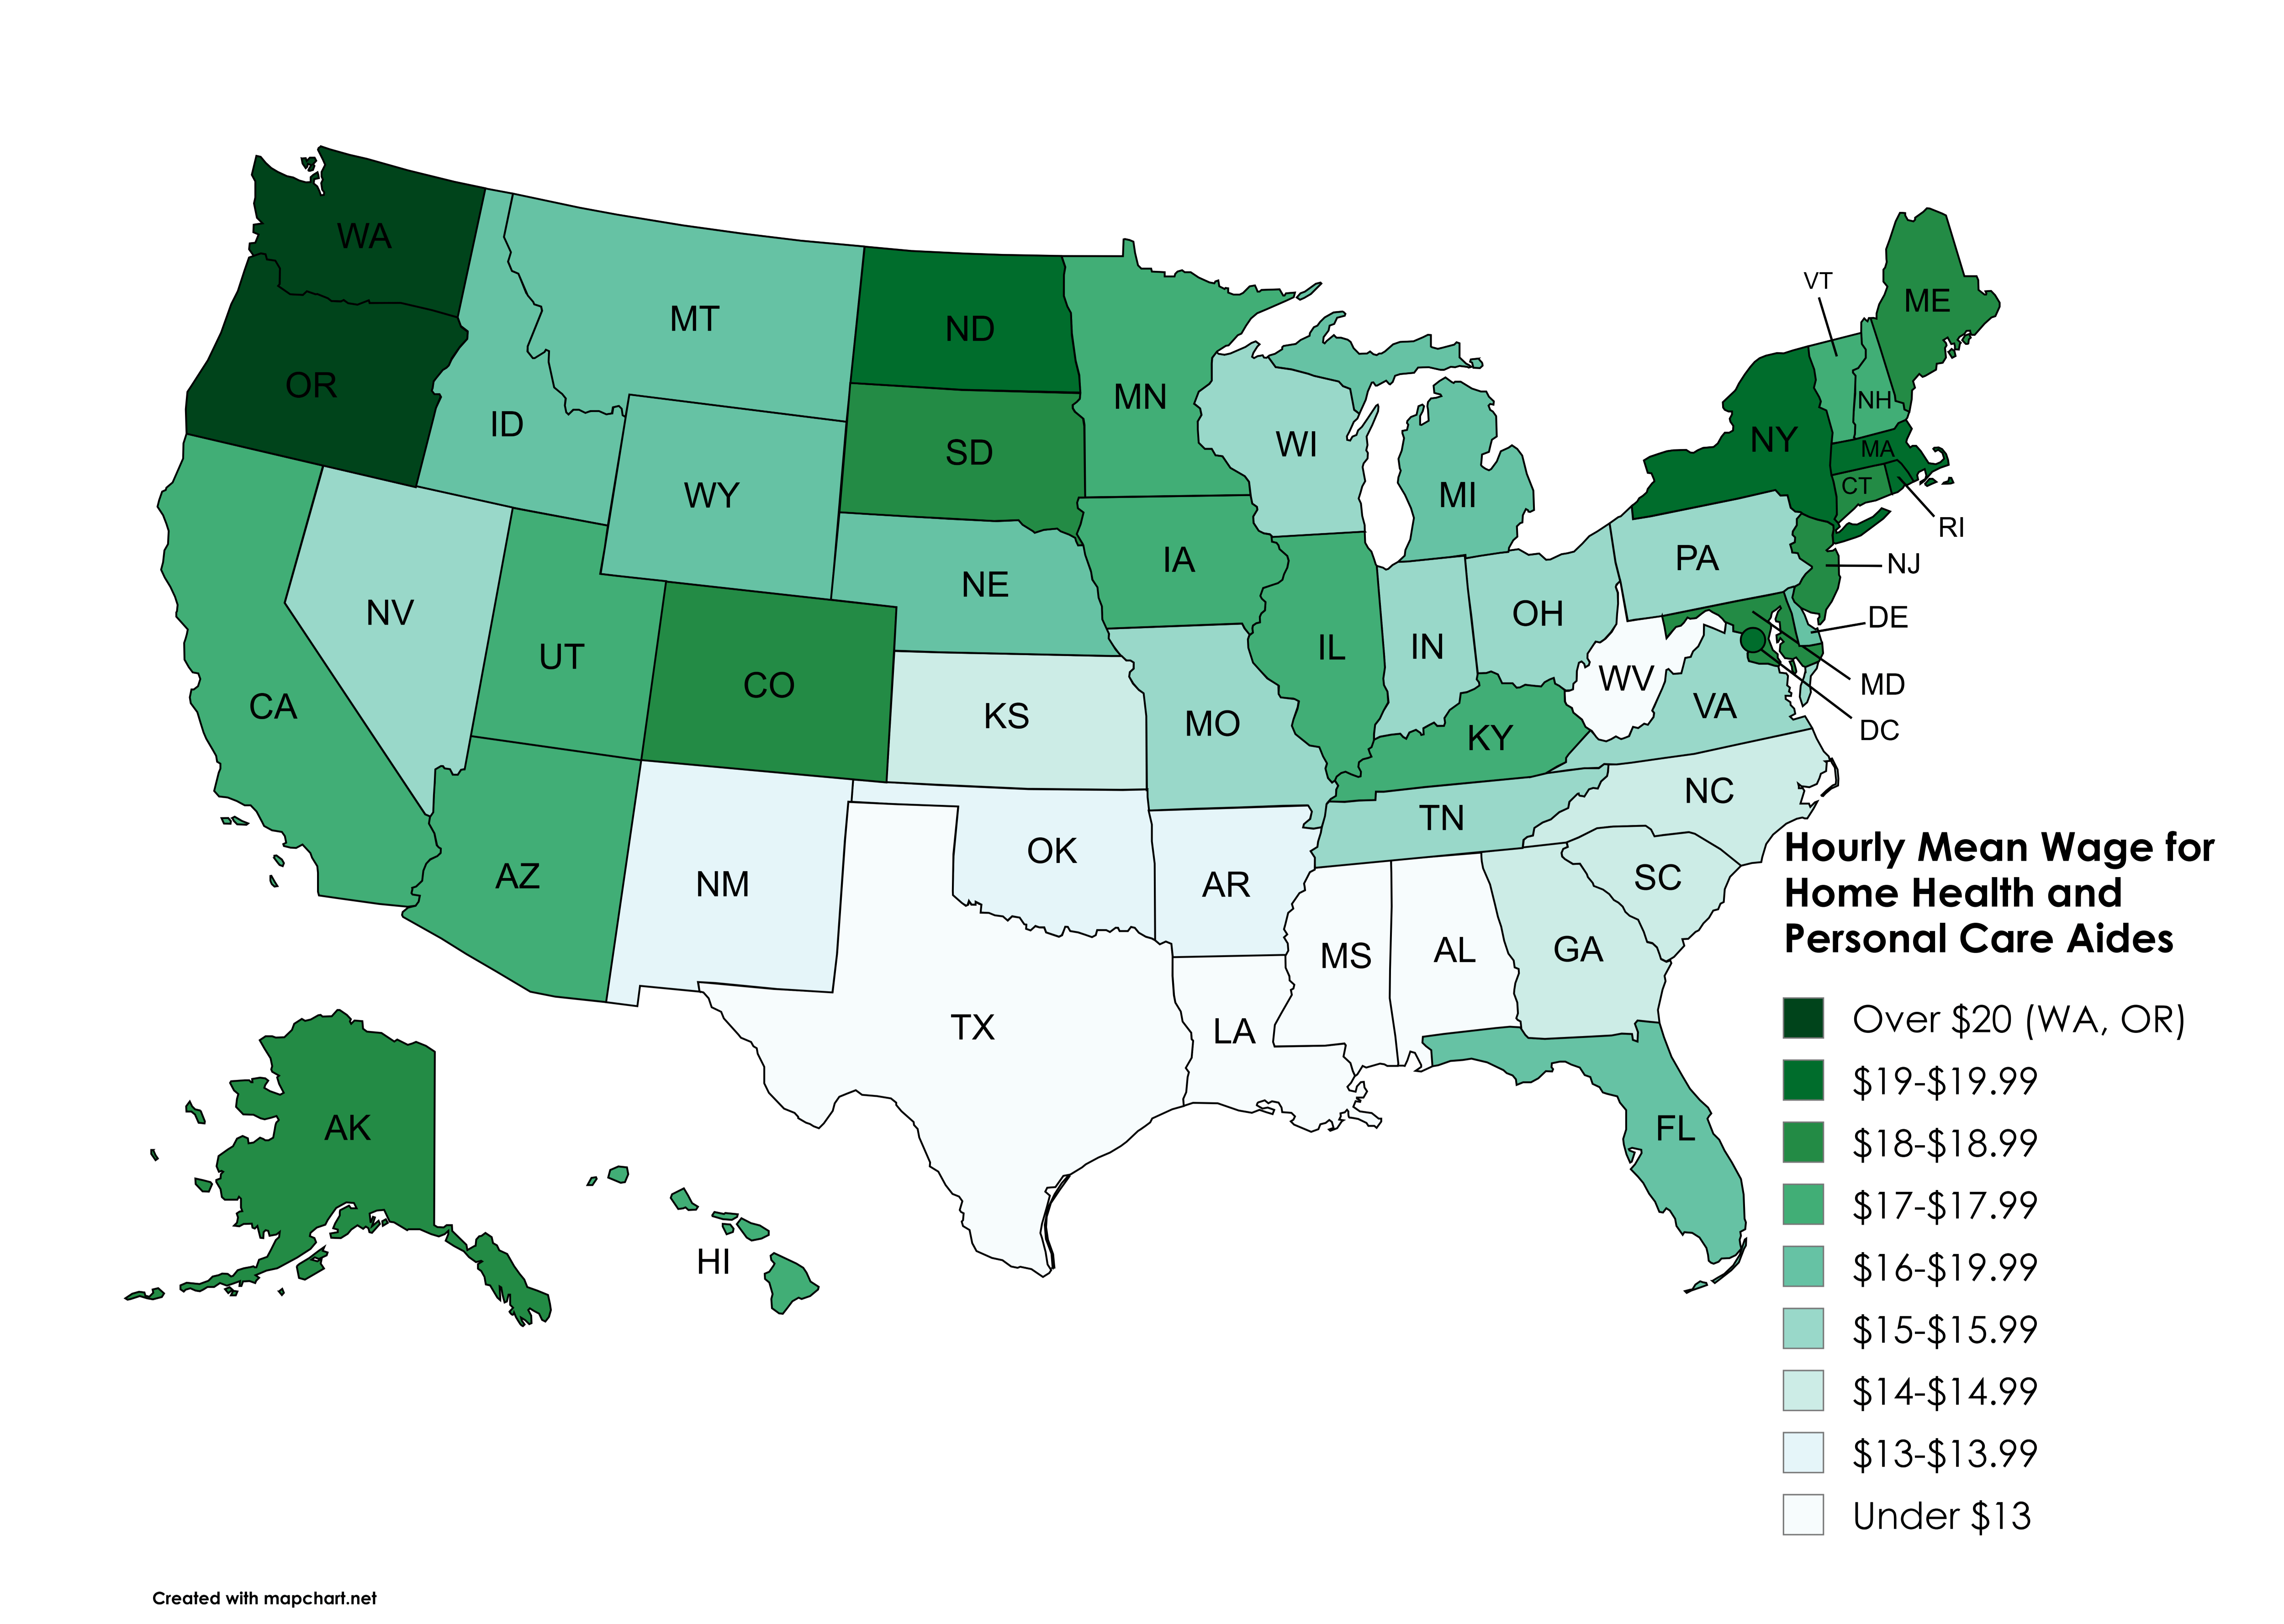
Data: BLS, Occupational Employment and Wage Statistics, https://www.bls.gov/oes/home.htm (use their Occupational Employment and Wage Statistics Query System to build a table of the data you want)
Tool: Mapchart https://www.mapchart.net/usa.html
Posted by snakkerdudaniel
5 comments
Data: BLS, Occupational Employment and Wage Statistics, [https://www.bls.gov/oes/home.htm](https://www.bls.gov/oes/home.htm) (use their Occupational Employment and Wage Statistics Query System to build a table of the data you want)
Tool: Mapchart [https://www.mapchart.net/usa.html](https://www.mapchart.net/usa.html)
I’m going to assume the *mean* is extremely correlated with entry level home health wages while *median* is correlated with more long-term industry wages?
Is North Dakota the highest paid vs cost of living?
Most of these are way too low for any state.
I think your scale has an error for the $16 range
Comments are closed.