This dataset15 served some research focused on assessing the seismic and landslide vulnerability of two RNs: one stretch connecting a hospital in Turin (Vanchiglia district) to the city limits of Chieri, passing through the village of Pino Torinese in a hilly countryside, and one connecting two hospitals in Naples, the Cardarelli Hospital and the San Gennaro Hospital, in an urban and densely populated environment, respectively for Turin and Naples, as depicted in Fig. 1.
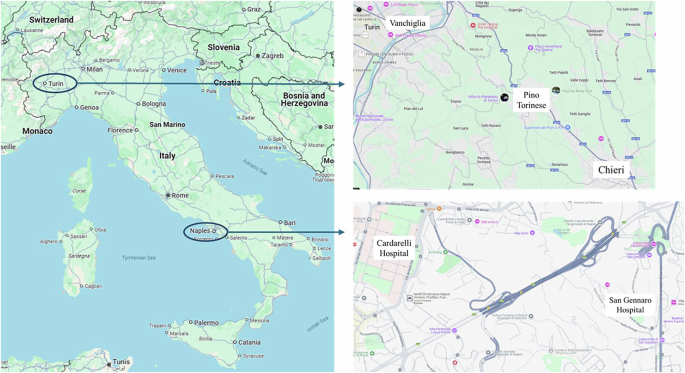
(a) Map of Italy showing Turin and Naples, and zoom in on the regions of interest for the city of (b) Turin, and (c) Naples.
The dataset15 is schematically organized as depicted in Fig. 2, as a workflow showing the steps for its creation and content, including case study setup, mapping of roads, structures, and landslides, extraction of attributes, hazard and vulnerability assessments through, respectively, seismic demand, defined in terms of peak ground acceleration, PGAd, and seismic capacity, namely, PGAc. The flowchart finally shows data organization.
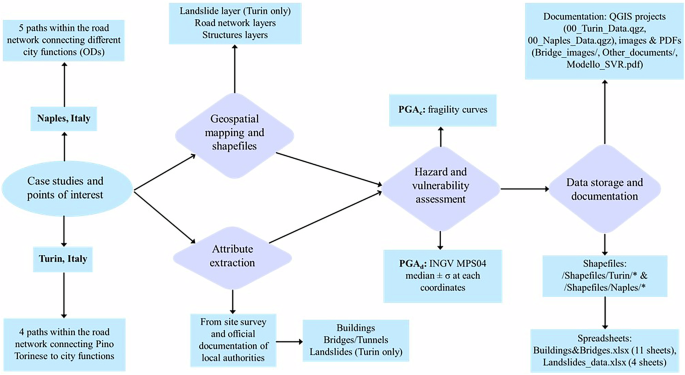
Flowchart describing the dataset.
Each path was selected based on its strategic importance for transportation, proximity to critical infrastructure, and shortest travel distance and time. In particular, for the Turin case study, the last tract from the city limits of Chieri to Chieri Hospital was not considered, as it is identical for all selected paths and does not include critical infrastructures, such as tunnels or bridges. More details can be found in Miano et al.10. Firstly, the routes were selected and spatially mapped on the open source software QGIS17, i.e., a public project hosted on www.QGIS.org, licensed under GNU GPLv2+. The procedure used for the QGIS project of both case studies is described schematically in Fig. 3. It consisted in identifying the city functions, i.e., the origin-destination (OD) points for the analyses. Specifically, in this study, we used hospitals as ODs. These define the terminals for a series of suitable connecting paths within the road network, and the characterization of potential structural and landslide interferences with the previously defined connecting paths.
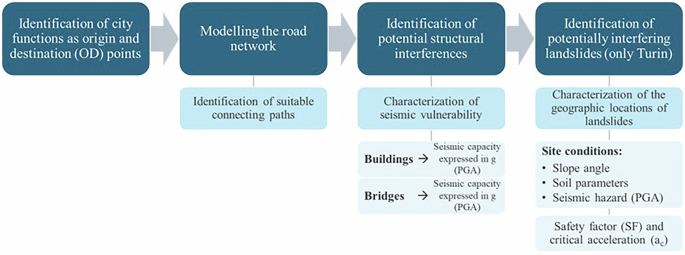
Flowchart describing the procedure adopted in the QGIS project of the dataset15.
Then, geological, seismic, and structural data were collected from online free sources (such as the INGV18, ISPRA19, GeoPortale Piemonte20, and GeoPortale Campania21 websites) or physical archives. These pieces of information were subsequently georeferenced and added to the database.
Four alternative paths were considered for Turin, as shown in Figs. 4 and 5:
1.
SS10 via Traforo del Pino (Pino Nuovo), crossing Ponte Sassi
2.
SS10 via Traforo del Pino (Pino Nuovo), crossing Corso Regina Margherita
3.
Corso Chieri (Pino Vecchio), crossing Ponte Sassi
4.
Corso Chieri (Pino Vecchio), crossing Corso Regina Margherita
For Naples, five paths were considered, as depicted in Figs. 6 and 7:
1.
URBA 1: Passes through Arenella, connecting to Tangenziale di Napoli.
2.
URBA 2: Travels through Colli Aminei and approaches the Policlinico area.
3.
TANA 1: Crosses under the Tangenziale di Napoli, near the Zona Ospedaliera connections.
4.
TANA 2: Passes through Capodimonte, crossing Via del Poggio
5.
TANA 3: crossing the Via Santa Teresa degli Scalzi bridge.

General overview of Turin’s geospatial data in the GIS software window, showing hospitals (red dots), paths (solid colored lines), buildings (blue dots), major infrastructures (i.e., bridges and tunnels, cyan), and landslides (brown areas). The four paths from (1) to (4) are given by: (1) the concatenation of the green and orange lines; (2) the green, dark blue, and red lines; (3) the purple, dark blue, and orange lines; and (4) the purple and red lines.
Where the acronym ‘URBA’ stands for urban and ‘TANA’ stands for Tangenziale di Napoli, as these three paths follow the urban A56 highway at some point, while the other two are limited to other regular city roads.
These configurations were analyzed simultaneously, considering the potential risks posed by nearby infrastructure, such as buildings, viaducts, and bridges, under seismic events, as well as assessing slope stability and the effects of rainfall-induced soil saturation.
For this, the dataset15 design involved two main phases: a qualitative mapping phase using spatial analysis software (the aforementioned QGIS, v3.34.11; https://qgis.org/) and a subsequent quantitative analysis phase employing seismic fragility curves.
Preliminary qualitative analysis and data mapping
The initial qualitative phase of the study involved a thorough mapping using QGIS software to organize and visualize the spatial data for the road network. The four paths for Turin and the five for Naples were mapped, including the identification and classification of surrounding buildings, viaducts, and the Traforo del Pino tunnel, for the Turin case study. Each structure was cataloged with its own attributes, as discussed in the Data Records section. The geographic coordinates (latitude and longitude) were recorded for each infrastructure point, establishing a spatial dataset within QGIS. For the viaducts, an initial site survey was conducted and later complemented with information from third-party surveys and official documentation from local authorities, wherever available. Figs. 8 and 9 show examples of the initial site surveying, whereas Fig. 10 shows examples of official documentation drawings that were accessed and represent typical transversal and longitudinal cross-sections of the bridge structures along the paths of the Turin case.
To complete the mapping for the Turin case study, since the paths go through rural areas too, landslide-prone areas were identified using datasets from Geoportale ARPA Piemonte (https://geoportale.arpa.piemonte.it/app/public/), the national IFFI landslide database (https://www.progettoiffi.isprambiente.it/), and the ISPRA IdroGeo landslide database (https://idrogeo.isprambiente.it/app/). These datasets provided a detailed list of past landslide events, including coordinates and geotechnical attributes of the soil, which were integrated into the shapefiles and spreadsheets. Additionally, a Digital Elevation Model (DEM) was imported to compute slope angles along each road segment, identifying regions with critical angles that increase the likelihood of landslides. For the Naples case study landslides were omitted, since the paths are in an urban environment not subject to landslide hazard.
Quantitative analysis using seismic fragility curves
Following the preceding qualitative phase, a quantitative analysis was performed to assess seismic vulnerability, and thus, it is worth introducing seismic risk in the context of the two Italian case studies. Risk is usually defined as the probability of loss at a specific location, and it results from the convolution of three parameters: seismic hazard, exposure, and vulnerability. Exposure is typically modeled from building census data, while seismic hazard is expressed through ground-motion parameters, such as the peak ground acceleration (PGA), correlated with damage levels via vulnerability functions. Extensive research has focused on the development of seismic risk maps for Italy, which were thoroughly analyzed and compared in an interesting study by Crowley et al.22. Italy ranks among the Mediterranean’s most seismically active regions due to its location at the convergence of the African and Eurasian plates. High seismicity is concentrated in central and southern regions along the Apennine chain, as well as in Calabria and the island of Sicily, and parts of northern Italy, including Friuli, portions of Veneto, and western Liguria. For this reason, regional governments in Italy, responsible for seismic classification, have categorized municipalities into four zones based on seismic hazard, defined by peak ground acceleration (ag) on rock sites, as follows:
Zone 1: Highest hazard, high probability of strong earthquakes (0.25 g ≤ 0.35 g);
Zone 2: Significant hazard, strong earthquakes possible (0.15 g ≤ 0.25 g);
Zone 3: Moderate hazard, lower likelihood of strong events (0.05 g ≤ 0.15 g);
Zone 4: Low hazard, very low probability of significant earthquakes (ag ≤ 0.05 g).
The city of Naples is classified in Zone 2, with a moderate-to-high seismic hazard, while Turin has lower seismicity and was reclassified from Zone 4 to Zone 3 in 2019.
This data paper aims to present a dataset15 for infrastructure visualization and vulnerability assessment. Vulnerability, a crucial component of seismic risk, quantifies the susceptibility of structures to earthquake damage. Various models for vulnerability assessment have been developed globally, particularly in the USA23, in China24, and in Europe25. Notably, Mediterranean countries exhibit similar seismicity, with significant progress in vulnerability modeling recently achieved also in the Balkan region26.
Quantitatively, vulnerability is frequently expressed through fragility curves, which represent the probability of exceeding specific damage states (DS) given an intensity measure (IM). The dataset associated with this paper provides the necessary inputs to evaluate infrastructure vulnerability using fragility curves calibrated for PGA.
In the context of the seismic vulnerability assessment, we calculate two critical parameters:
The PGAd (demand Peak Ground Acceleration), which indicates the expected seismic acceleration in the area during an earthquake with a 475-year return period (i.e., a strong quake that statistically happens once every 475 years). To calculate these values, the model MPS04 from the Istituto Nazionale di Geofisica e Vulcanologia (INGV, https://esse1-gis.mi.ingv.it/) was used. By entering the exact location (latitude and longitude), the results obtained are three values (for the 16th, 50th, and 84th percentiles). These numbers represent the possible range of shaking intensity at each site, from the least intense (16th percentile) to the most intense (84th percentile). Then, based on the 50th percentile value (median) and the standard deviation of the data, a random distribution is defined by Miano et al.10,27 to calculate the PGAd along the network.
The PGAc (capacity Peak Ground Acceleration), which signifies the peak acceleration at which a structure loses its functional capacity, was obtained by using seismic fragility curves. These curves provide the structures’ seismic thresholds for various damage states. In this dataset15, two states were considered: the ultimate limit state (“SLV”) and the serviceability limit state (“SLD”). Similar to the calculation of PGAd, the values of the 50th percentile (median) and standard deviation, described in the following section, have been used to calculate the values of SLV and SLD for each structure through a random distribution defined by Miano et al.10,27. Building heights, materials, and construction periods were considered for characterizing buildings and identifying their PGAc based on previous studies. Similarly, for bridges, the length and spans of bridges were used to distinguish them and associate them with bridges from previous studies for PGAc definition.
Regarding PGAc,, the estimation of fragility curves was made using MATLAB for curve interpolation and QGIS for spatial data integration. For each viaduct, additional field data, such as the number of spans, pile count, static scheme, and deck type, were gathered during site inspections, enhancing the accuracy of the fragility curves applied.
Given that the viaducts considered in this dataset resembled the characteristics of the Siatista Bridge described in the study of Moschonas et al.13, the Siatista’s fragility curve, reproduced in Fig. 11, was used as a baseline for analysis.
From this curve, SLV values were identified by taking the 50% probability of these thresholds for the extensive damage (ultimate limit state) at 0.465 g. For SLD values, the mean of slight and moderate damage (serviceability limit state) was taken at 0.193 g. Additional fragility curve data were sourced from Nielson28, which categorizes viaducts based on construction material and span count. Most viaducts in this dataset are concrete, three-span structures. Median values for both extensive damage and slight to moderate damage were drawn from the findings of Nielson28. For viaducts with six or more spans, fragility data were obtained from Cardone et al.14 on multi-span simply supported deck bridges. The SLV and SLD values from this study were applied to the corresponding rows in the spreadsheet and shapefiles.
For buildings, empirical fragility curves were applied, differentiating seismic capacity based on structural material (reinforced concrete or unreinforced masonry). Specifically, these were retrieved from studies by Rost et al. for buildings made of unreinforced masonry11 and reinforced concrete12. According to the set of curves specified in these two works, the buildings were further differentiated based on their construction period (with special emphasis on those built before 1981, as they do not adhere to current seismic codes) and height.
Please note that structural material classification was not always available; therefore, the reference papers by Miano et al.10,27 have performed the studies assuming that the buildings for which material identification has not been possible are made of reinforced concrete.
The probability thresholds for PGAc (SLD and SLV) were defined based on the fragility curve values of PGA that correspond to different seismic damage states. This is reported as an example for reinforced concrete residential buildings in Table 1, where the values reported in the table indicate the medians and standard deviation of lognormal distributions of PGAc for different damage states (DS1 to DS5) empirically associated with buildings by Rosti et al.12, as derived from hazard maps introduced by INGV18.
Based on the values reported in Table 1, Miano et al.10 considered the values of PGAc of reinforced concrete buildings using DS3 for the SLV condition while applying an average between DS1 and DS2 for the SLD condition. Then, by comparing PGAc with PGAd, both obtained by the random distributions described by Miano et al.10,27, it is possible to assess the response of structures along the paths and determine their likelihood of failure.
It is noteworthy that, in addition to earthquakes, landslides are also prevalent in Italy29, and several studies have investigated their impacts on the population30. Thus, regarding landslides, the surveyed data concerning topography and soil parameters is provided in this dataset, as well as the relevant Safety Factor (SF) and critical acceleration31. Note that research in this field is ongoing, and a specific methodology to assess the resilience of networks under earthquake-induced landslides has yet to be validated. However, the domain of the dataset presented in this paper has already been validated. This ongoing research focuses on the impact of landslides on road networks, considering different saturation scenarios, and includes the impact of soil water content on slope stability. A saturation parameter is varied between 0 (dry conditions) and 1 (fully saturated) to represent best- and worst-case scenarios. Newmark displacement’s method is then used to model slope behavior under seismic conditions, incorporating acceleration-time histories and critical acceleration to estimate the displacement of landslides along the road network. Further details can be found in Louagie et al.32.