![[OC] Origins of visitors to Acadia NP, Maine](https://www.europesays.com/wp-content/uploads/2025/10/ijhhbcjy9stf1-1861x1024.png)
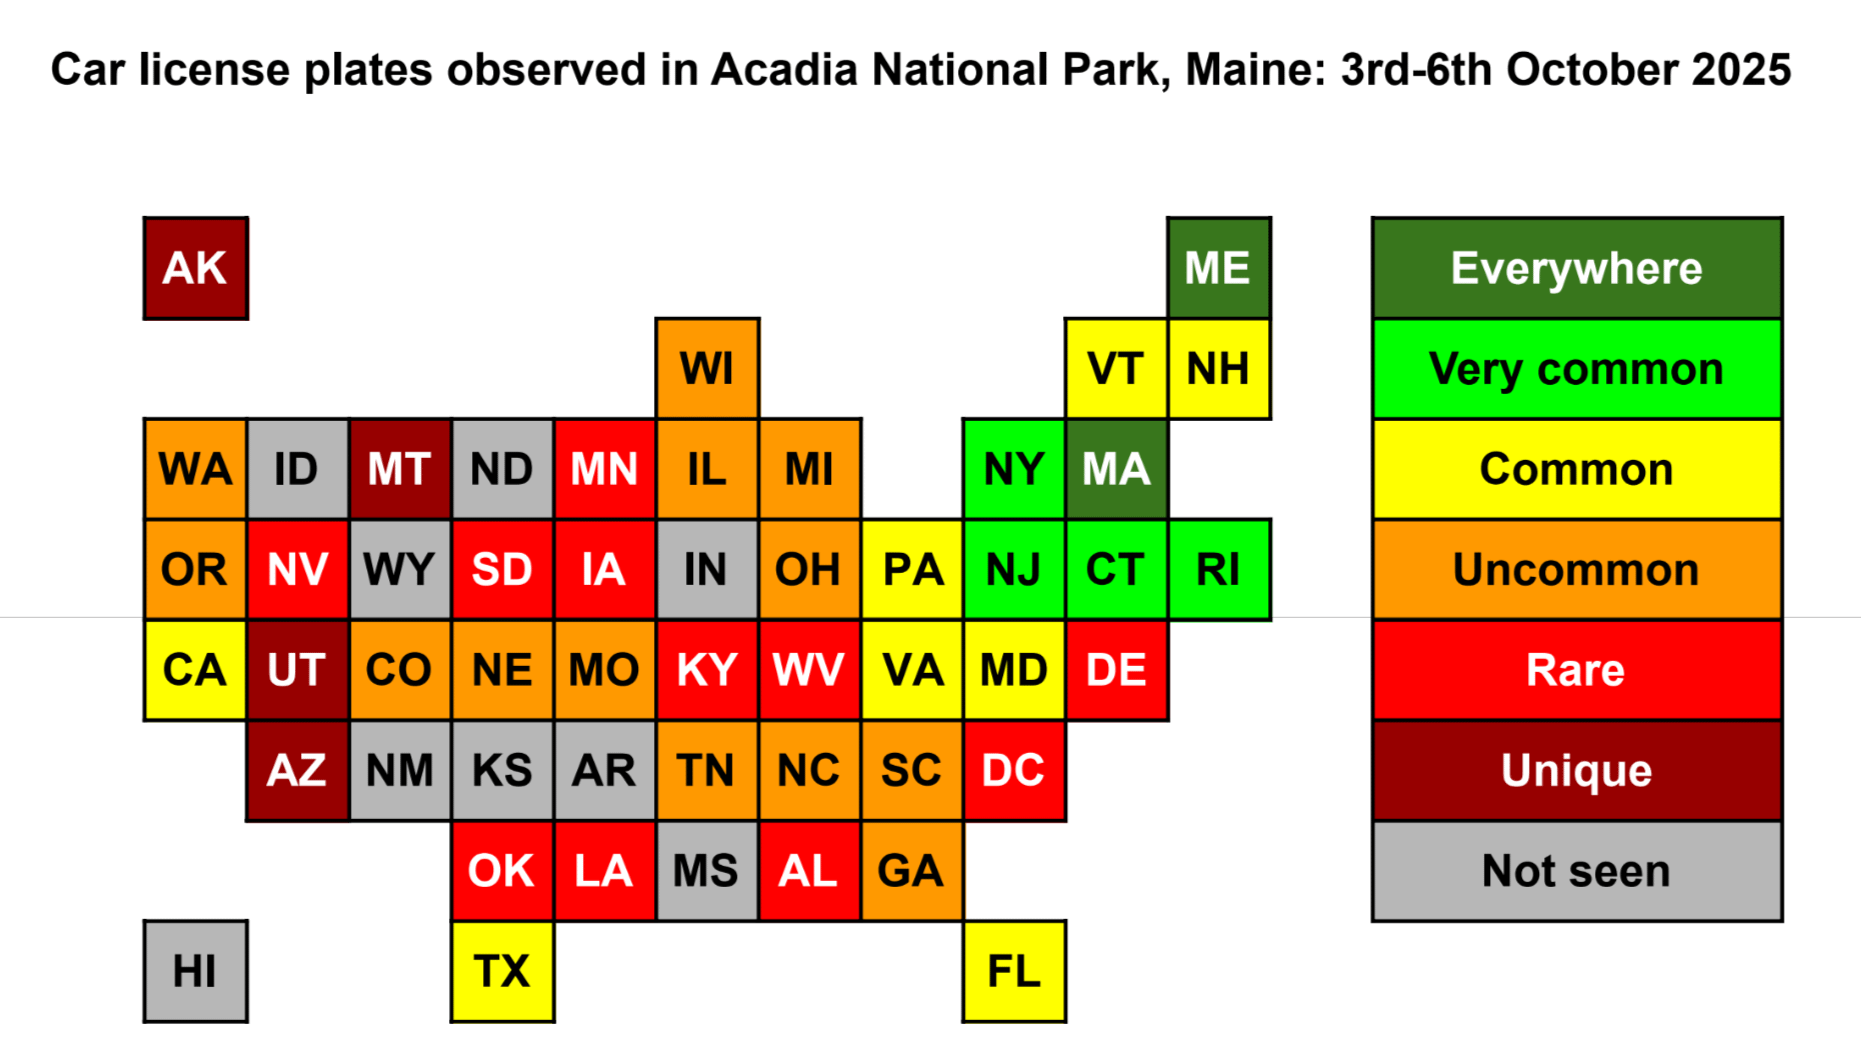
I was in Acadia NP for 4 days this week, and I was amazed to see so many cars from so far away. I mean, I'd read somewhere that Acadia is one of the most popular national parks in the USA, but even so the diversity of visitors' origins surprised me. So I started logging them.
Data collection: manual, informal.
Data visualisation: Google Sheets.
PS – Yeah, I know the state in which a car is registered doesn't really tell you where the driver is from. For example I was driving a car registered in Massachusetts, and I'm from the UK. But I figure it's still an interesting proxy.
PPS – Not shown on this map: a small handful from Ontario, one from Nova Scotia, and one from an EU country, probably Germany.
Posted by SomethingMoreToSay
8 comments
We visited in a rented car with Minnesota plates…from North Carolina
Ok first, Acadia is awesome! But second, the effort is heroic but what’s the approximate sample size here?
Since when is North Carolina west of DC and adjacent to WV? And don’t get started on Nevada/Utah or NY/CT.
Why does this grid representation of the map make more sense than a traditional map or any other representation?
This is interesting info, but entirely unreadable for the colorblind
This is attractive, but I’m not sure there is any actual data here. I don’t see any way to extract any numbers from this image.
What is “everywhere” vs “rare”? Your categories are very subjective: did you literally see Maine plates everywhere? — even when you were seeing the Arizona plate? What or who decides the difference between common and very common?
Is “rare” based on the number of plates seen? Or the number of plates you counted? “A small handful from Ontario” must be more than a “unique” plate, so that needs to be included in some way.
Was this data taken scientifically? That is, were you sampling regularly from a from a consistent observation point? How many samples?
This needs *ate least* a chart with axes, probably a table. Given what trends are actually visible, the small sample size probably makes error bounds necessary.
All I can draw from this is “The farther away from a state you are, the fewer license plates for that state you see,” which isn’t terribly groundbreaking, or even interesting.
Data needs some numbers beyond the date. All I can assume is that “Everywhere” means you saw at least 6 cars
Im here in vermont for two years from wyoming (work). Excited to show my plate everywhere and put wyoming on the map! We’re catching up!
Comments are closed.