![[OC] 2024 US Presidential Election: including All Eligible Voters](https://www.europesays.com/wp-content/uploads/2025/10/dqvjinu6ogvf1-1920x1024.png)
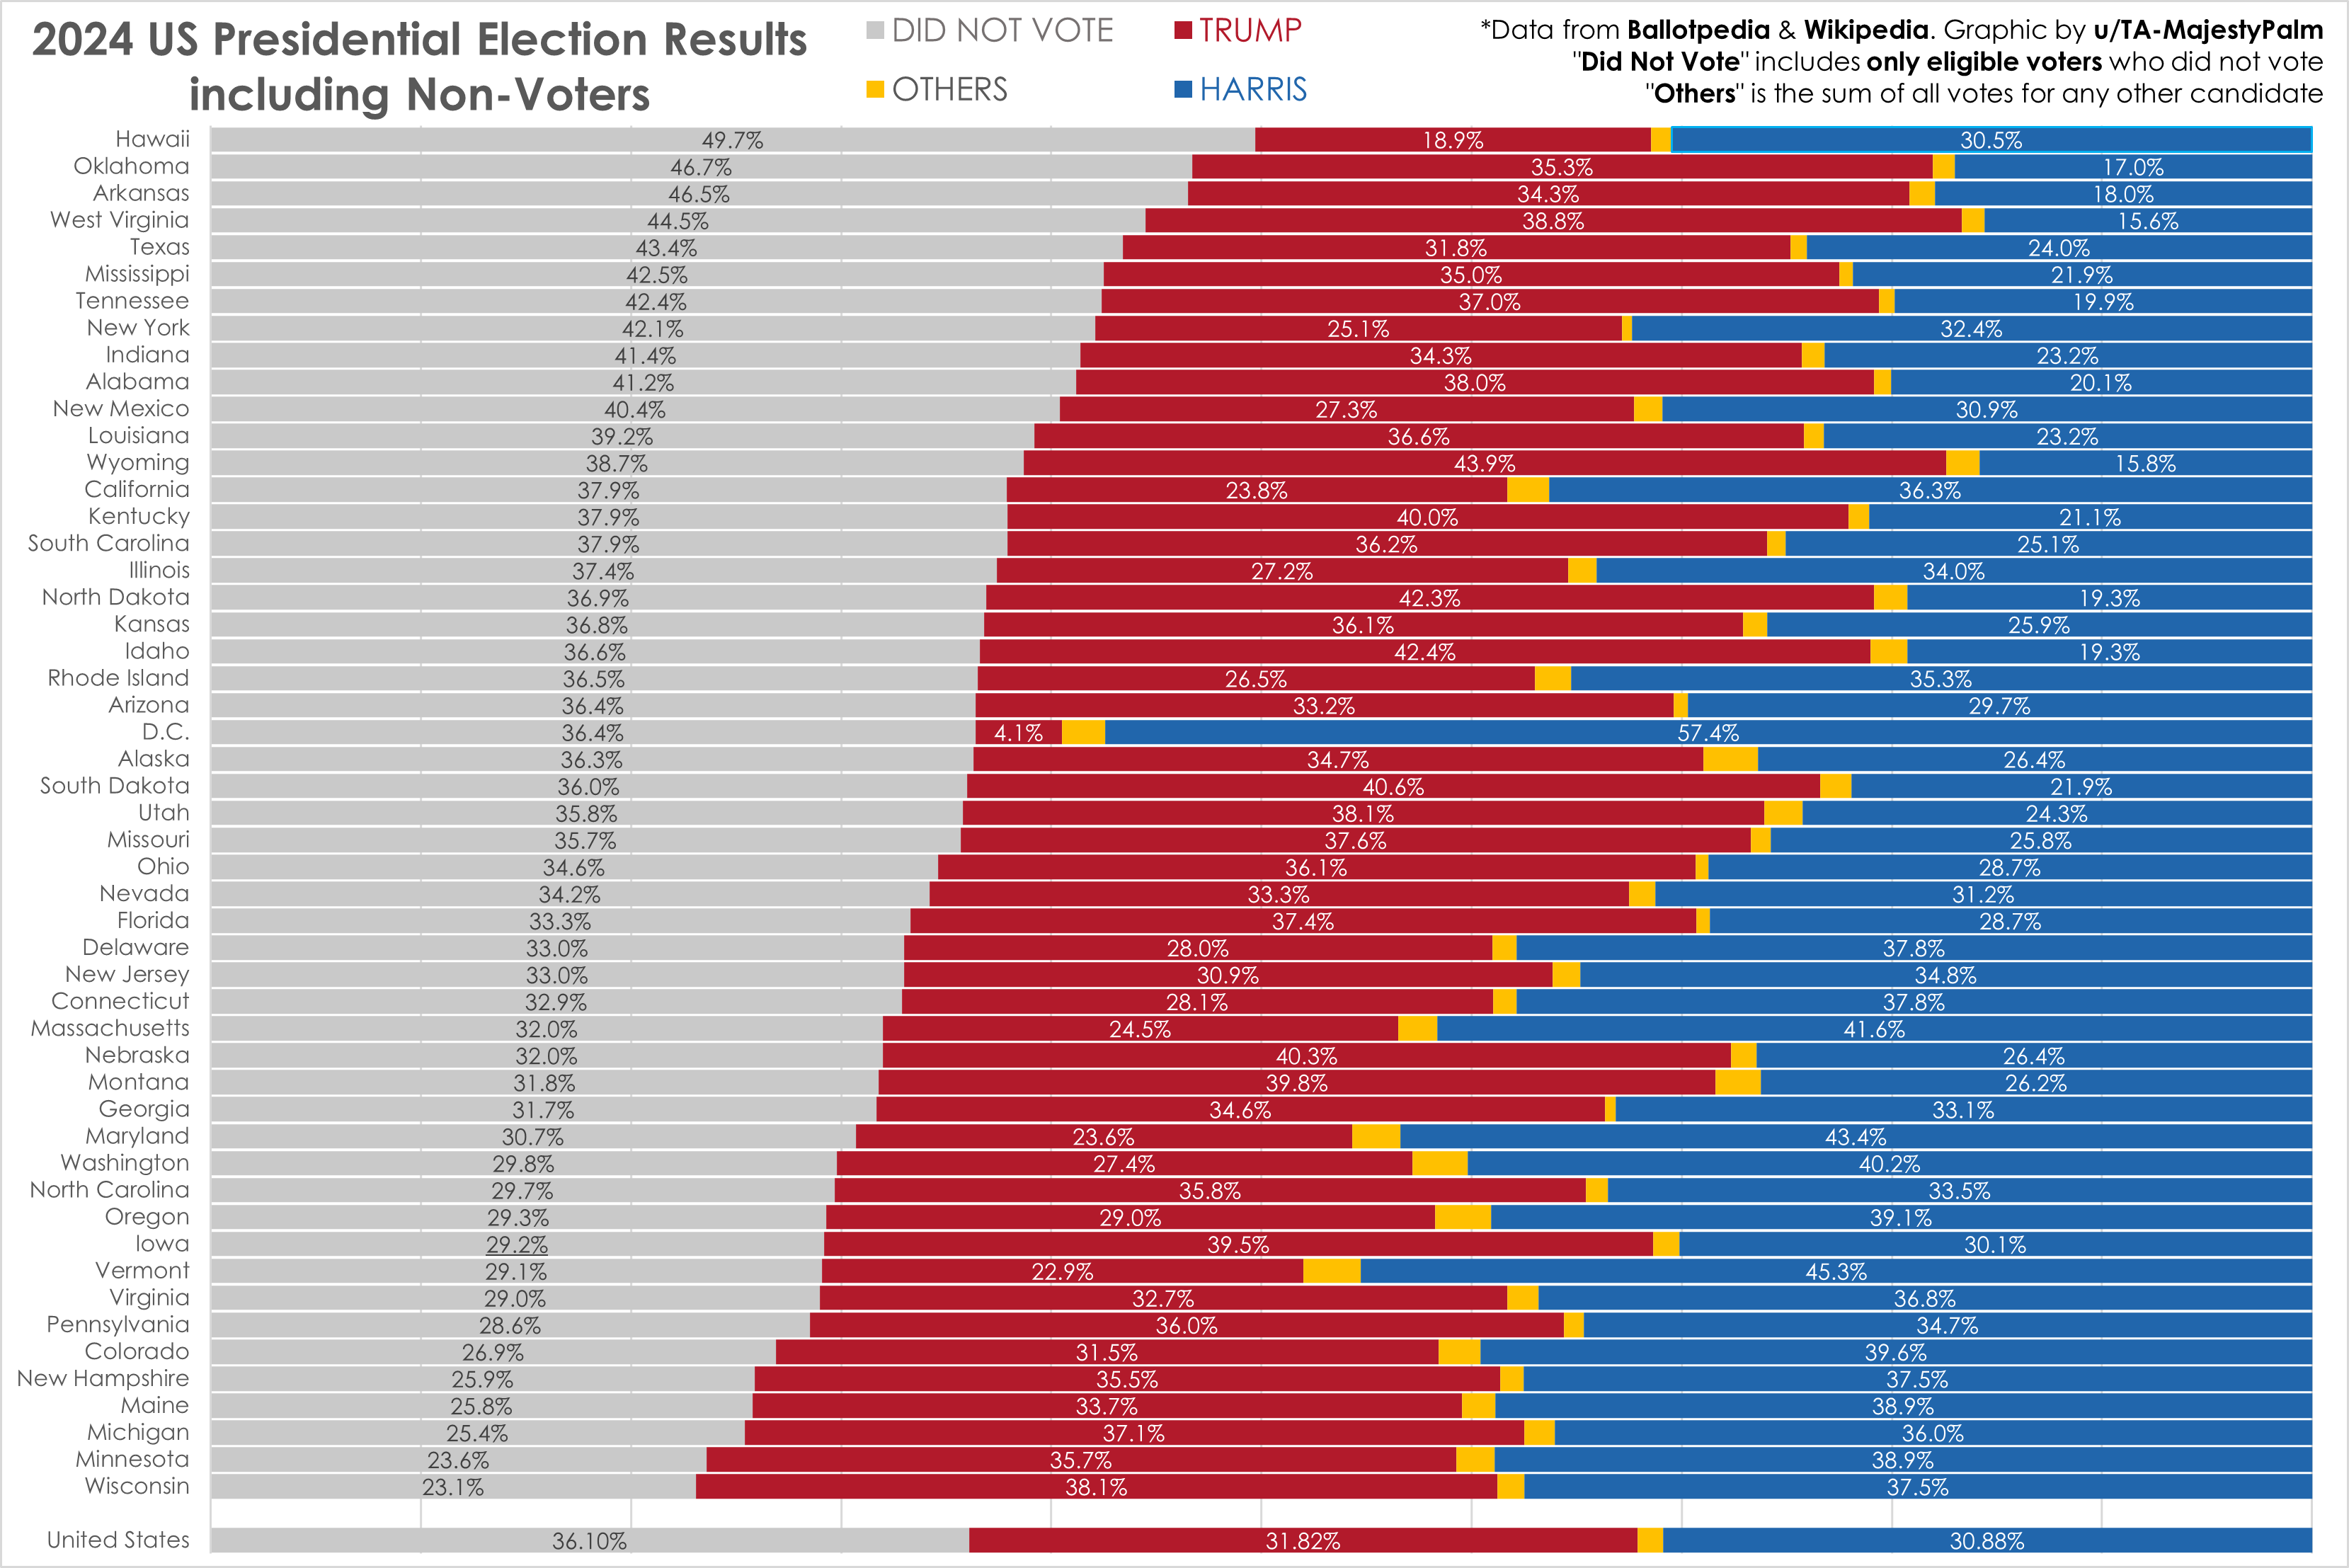
Graphic by me, created in Excel. Source data is from Ballotpedia and Wikipedia.
We've all seen many election graphics but I wanted to highlight the fact that the largest group of potential voters was non voters.
"Non Voters" only includes ELIGIBLE voters that didn't vote: it does not include those under 18, non-citizens, felons etc.
You can also see that being a "Swing State" has an affect on turnout: the states with the tightest margins are all towards the bottom of the graphic (WI, MI, NH, PA, GA).
Source links: https://ballotpedia.org/Election_results,_2024:_Analysis_of_voter_turnout_in_the_2024_general_election and https://en.wikipedia.org/wiki/2024_United_States_presidential_election
Posted by TA-MajestyPalm
28 comments
Graphic by me, created in Excel. Source data is from Ballotpedia and Wikipedia.
We’ve all seen many election graphics but I wanted to highlight the fact that the largest group of potential voters was non voters (that were still eligible to vote).
“Non Voters” only includes ELIGIBLE voters that didn’t vote: it does not include those under 18, non-citizens, felons etc.
You can also see that being a “Swing State” has an affect on turnout: the states with the tightest margins are all towards the bottom of the graphic (WI, MI, NH, PA, GA).
Source links: https://ballotpedia.org/Election_results,_2024:_Analysis_of_voter_turnout_in_the_2024_general_election and https://en.wikipedia.org/wiki/2024_United_States_presidential_election
It’s very trendy to shit on non voters instead of actually addressing what’s wrong with our political system and our god awful candidates that only answer to corporations.
The non voter crowd will only grow bigger in the future as people wake up to our travesty of a system that only benefits the rich.
> You can also see that being a “Swing State” has an affect on turnout
So .. people go voting if they feel like their vote actually matters? And don’t go if it doesn’t?
Great chart! Very impressed to see this data presented so clearly.
Because the margins are so slim it would be nice to add an indicator (maybe a coloured dot by the state name) to show who won. My take from a quick glance is that Republican states are also the ones with lower voter turnout.
Voting is like a fucking sports event here in Minnesota. Everyone tells everyone to get out and vote, but will bitch at you depending on what it is.
Looks like the most lopsided states also affect turnout.
How many states did “Did not vote” win?
The “did not vote” group kills me 😭
This is a good presentation of data.
4 of the top 12 voter turnout states have all-mail voting. Definitely seems to increase participation.
Democrats will look at this and think there is nothing wrong with our message and approach to the voters. How fucking incompetent you have to be to lose against Trump two times?
They’ll go and continue to blame voters and wonder why they are more unpopular than Trump.
Holy fuck. That’s a lot of did not vote.
So if we assumed non-voters had a candidate, would that candidate have actually won the election?
Don’t forget and he will remind you often that he has a mandate! Lmao
Voting should be mandatory, but there should also be a “none of the above” option.
Wow, Hawaii really hates voting (not that I blame them, we deposed their Queen)
Fun fact, who is the only President who got a higher percentage of the vote then “Did Not Vote” in past 60 years”?
Biden!?!?!?
https://www.reddit.com/r/dataisbeautiful/s/PVosXcN2sK
Nice chart. Texas is really eye-opening. For all the conversation around the state’s purple turn, Trump put up W numbers.
Great Lakes showing up at the polls! 💪🏼
My only thought would be to put the non voters in the center because then it could be easier to compare outcome of each political party since they’d both have the edge of the graph as a starting point
Every swing state was also buried in ads, that plus what you said about knowing it would be close drove turnout. It is interesting that the New England states had relatively high turnout despite not being competitive. Higher value placed on civic participation?
Congrats OP. This looks great. Thanks for including non-voters.
Excellent graphic to dispel a false narratives about this election that low turnout sank Harris. In fact, turnout increased compared to 2020 in the most decisive states.
In an electoral college system, the turnout in noncompetitive states is irrelevant because resources go to the most likely electoral tipping point states
So the true winner is did not vote. Thst is something
It’s worth noting that “non-voters” doesn’t necessarily translate to “didn’t vote”.
There are many people who could’ve not voted on the president but voted in senate/governor/local elections, or people could’ve moved to a different state and voted there (instead of their original state).
There’s so much untapped potential in reaching out to non-voters and seeing what would get them to show up to the polls. If you’re trying to appeal to the other party’s voter base, you’re going up against the fact that they already like their person *and* you risk losing your own voters in the process. If you’re trying to appeal to non-voters, they’re not already sold on your opponent so you just need to listen to their concerns and see how you can address them.
Genuinely curious why so many people find the need to mention non voters which has been a constant variable for 50 years…
I can see why he targeted DC first.
It’s kind of wild to see 36% of the population not voting and the majority vote taking the win with less than that. There is something wrong with our system and/or its users.
Comments are closed.