Data: CDC (https://gis.cdc.gov/grasp/diabetes/diabetesatlas-surveillance.html#)
Tool: Mapchart (https://www.mapchart.net/usa.html)
Posted by snakkerdudaniel
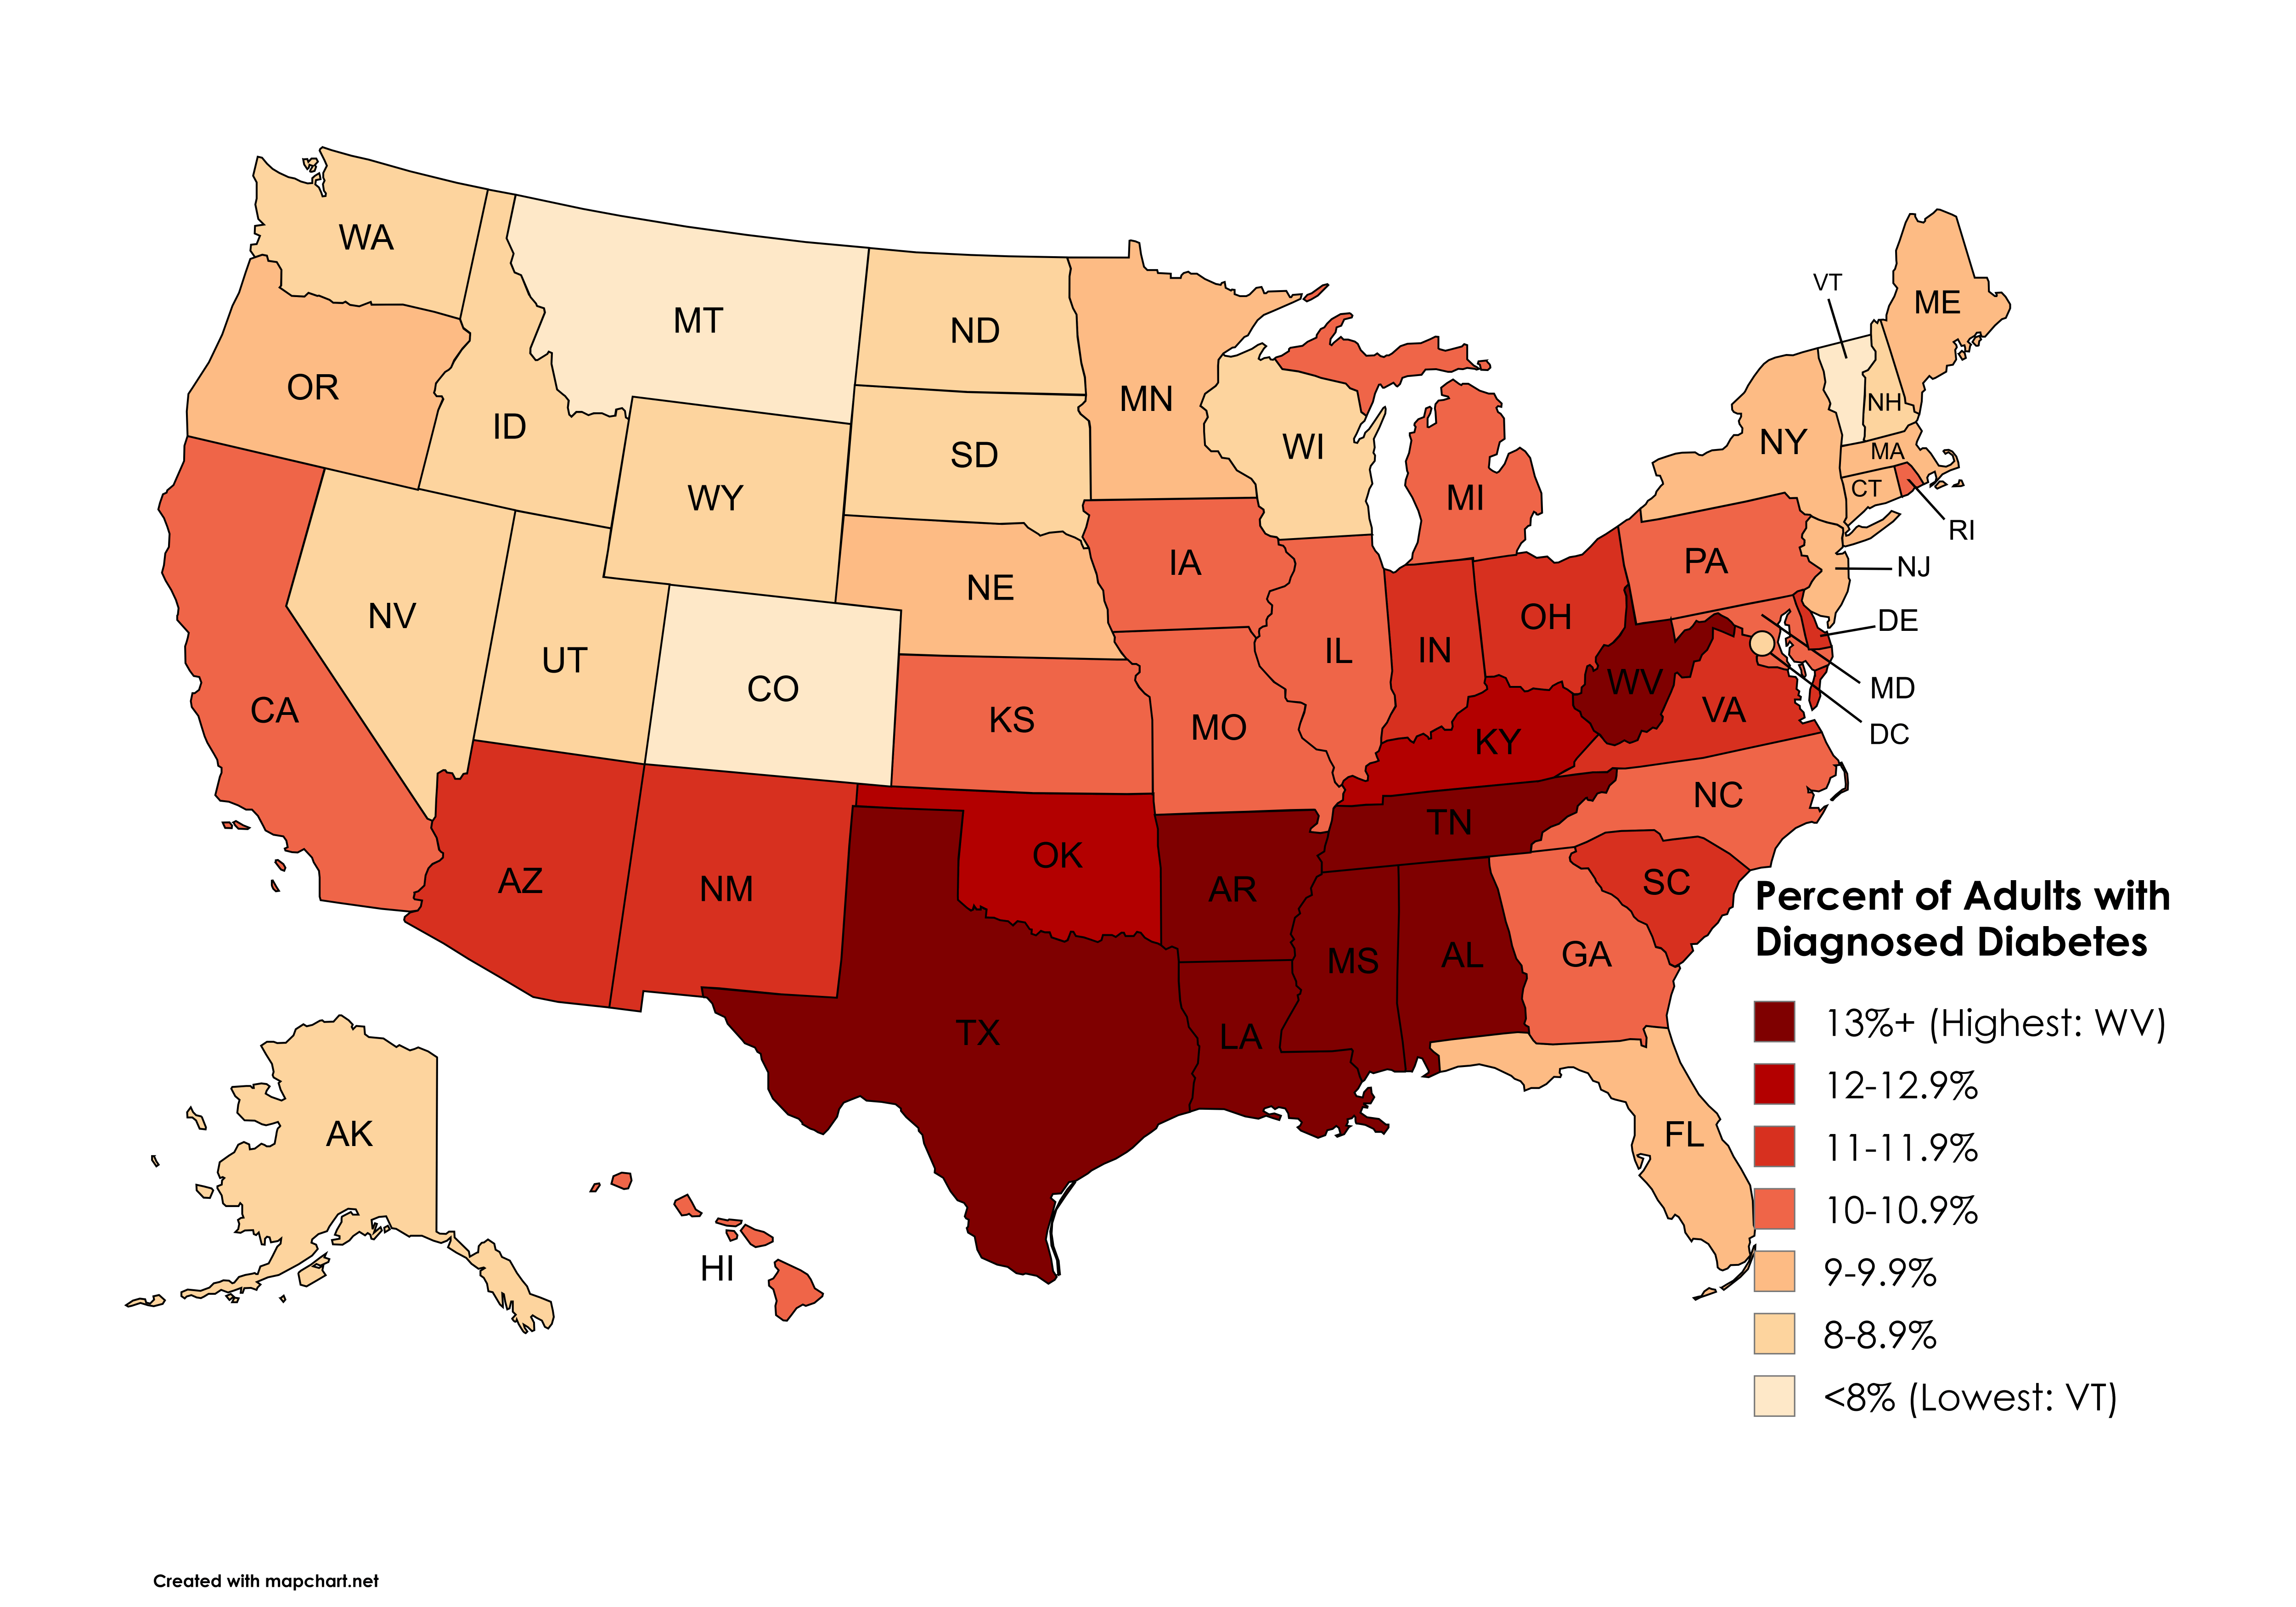
![[OC] Percent of Adults with Diagnosed Diabetes by U.S. State (2022)](https://www.europesays.com/wp-content/uploads/2025/10/cd2r2xrttrvf1-1920x1024.png)
Data: CDC (https://gis.cdc.gov/grasp/diabetes/diabetesatlas-surveillance.html#)
Tool: Mapchart (https://www.mapchart.net/usa.html)
Posted by snakkerdudaniel
31 comments
Data: **CDC (https://gis.cdc.gov/grasp/diabetes/diabetesatlas-surveillance.html#)**
Tool: **Mapchart (https://www.mapchart.net/usa.html)**
Colorado beat Mass for once.
Oh yeah, the South leading the way in another shitty stat. Lots of leopard face eating going into on there
Is it states that use more lard and crisco shortening in their cooking? Or just poorer where they eat more processed garbage?
[deleted]
I bet it’s because of sweet tea and beer.
Rhode Island, the armpit of New England again
I would love to see this pattern by county and next to a map of poverty rate by county next to it. Like, are rich white people in the south getting diabetes just to spite black people? Or are there just that many poor people in those states that it drags down the averages?
Apparently 3 things now come from Texas.
These type of color coded maps almost always look the same. Same states always in the bad shade of whatever color they are using….
Oh look, it’s The Map again.
From the CDC FAQ:
“The surveys and databases used by the U.S. Diabetes Surveillance System do not currently distinguish between types of diabetes. Therefore, our estimates include data on all types of diabetes. Because type 2 diabetes accounts for about 90% to 95% of the cases of diagnosed diabetes in adults, trends in type 2 diabetes are likely to be similar to trends documented by the surveillance system. However, because type 1 diabetes accounts for approximately 5% of all diagnosed cases of diabetes among adults, trends documented in the surveillance system may not reflect trends in type 1 diabetes.”
everything is bigger in texas
Thank goodness for Texas holding back the south from spreading to the west and north west.
Once again, God has forsaken the Bible Belt.
What makes Florida special? They are the “healthiest” state in the south.
And they’re about to lose their health care
5.1% of Australia’s population had diabetes (exc gestational) in 2021. That would be 6.5% of adults.
Would it be possible to get this at a global level?
Makes sense as that is where the best food is at
overlay confederate states
Why is it always Red States lead in the worst catagories.
Now show a graph of areas that voted against nationalized health care.
Insulin is expensive yo.
Would it be possible to see this refactored as a rate for per, say, 1,000 citizens? I feel that would be a lot more telling that a flat percentage, given the wide variety of population between states.
The distended belly of the US
There’s no way Florida is not Red from diabetus
Wait until the GOP cuts healthcare.
I have heard a phrase proudly shouted by our southern citizens, ” The south’s gonna do it again!” Congratulations, to y’all. Once again you guys are number 1 at being at the bottom. I have to be honest and say this truly bothers me. I love the south and its people. I just don’t understand why you accept this. Please do better. I know you can.
The highest % states are the same ones that support Trump as he guts healthcare. Maybe they should just stop testing, like Trump suggested for COVID, and those numbers would miraculously go down…
My understanding is the current plan to combat this is to restrict access to healthcare, and then less people will be diagnosed as they can’t afford to go to the doctor, and this number will go down, while at the same time reducing government spending. Win win (for everyone that doesn’t have undiagnosed diabetes).
Cold weather actually does help lower insulin resistance which is a leading factor in formation of diabetes.
So obese people in the north get an assist from Mother Nature if exposed to cold for long periods of time
Which is unavoidable in MN and WI
Comments are closed.