
If you’ve been eyeing NextDecade lately, you’re not alone. With shares closing recently at $6.10, there’s been no shortage of chatter from those debating whether now is the right time to jump in. Over the past year, the stock shot up an impressive 10.5%. If you zoom out even further, that five-year gain sits at a massive 119.4%. However, the ride hasn’t been all smooth. Just in the past week, shares dropped by 5.6% and they’re down 26.5% for the year so far. Clearly, the market’s view on NextDecade can shift quickly. That volatility likely ties back to ongoing uncertainty in the energy sector and investor sentiment about the company’s ambitious liquefied natural gas projects.
What’s really driving the story behind these price moves? Some of the ups and downs can be traced to broader market conditions and shifting perspectives on energy demand, especially as the world keeps navigating the energy transition. Confidence in future growth prospects is sometimes offset by the sector’s risk profile, and NextDecade’s journey reflects that push and pull. If you’re looking for a simple value answer, the numbers alone might give pause. The company clocks in with a valuation score of 0 out of 6, meaning it’s not currently undervalued in any of the key standard checks we use to gauge a bargain.
Still, stock stories are rarely that straightforward. Let’s break down the usual valuation yardsticks, then dig into a smarter, more nuanced way to think about whether NextDecade is worth your attention today.
NextDecade scores just 0/6 on our valuation checks. See what other red flags we found in the full valuation breakdown.
Approach 1: NextDecade Dividend Discount Model (DDM) Analysis
The Dividend Discount Model (DDM) estimates a company’s fair value by projecting its future dividend payments and discounting them back to today. This approach works best for firms with predictable, sustainable dividends and profit growth.
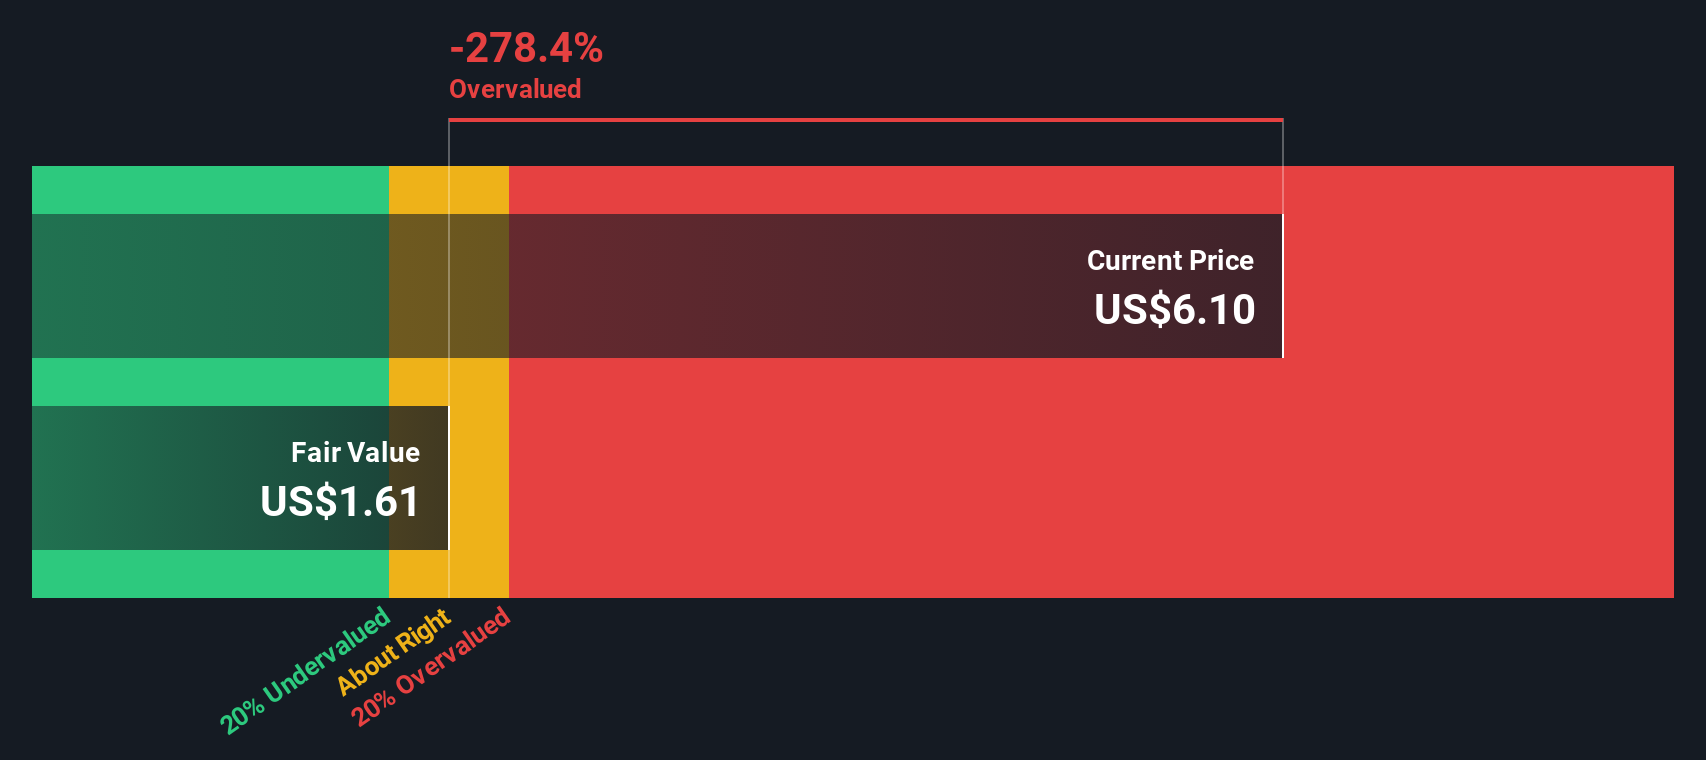
For NextDecade, the DDM reveals red flags. The company’s most recent annual dividend per share (DPS) sits at $0.35, but payout is a negative 10.1%, stemming from deeply negative earnings. Return on equity (ROE) is negative 14.7%, meaning the business is currently running at a loss rather than generating profits for shareholders. Expected long-term dividend growth, calculated as (1 – payout ratio) x ROE, is negative 14.7%, which signals that dividends are likely to shrink or are unsustainable in the near term.
Given these projections, the DDM model estimates an intrinsic share value of just $1.61. With shares currently trading at $6.10, NextDecade stock appears 278.4% overvalued according to this model.
Result: OVERVALUED
 NEXT Discounted Cash Flow as at Oct 2025
Our Dividend Discount Model (DDM) analysis suggests NextDecade may be overvalued by 278.4%. Find undervalued stocks or create your own screener to find better value opportunities.
Approach 2: NextDecade Price vs Book
For companies in capital-intensive sectors like Oil and Gas, the price-to-book (PB) ratio is often a go-to valuation metric, especially when profits are volatile or negative. The PB ratio compares a company’s market value to its book value on the balance sheet and offers a reality check on what investors are paying for the company’s assets.
Typically, a “normal” or “fair” PB ratio for a business will reflect expectations for future growth as well as the risks it faces. Faster-growing or more profitable companies may command higher PB ratios. Firms with uncertain outlooks generally trade closer to, or even below, their book value.
NextDecade’s current PB ratio is 6.14x. That is well above both the Oil and Gas industry average of 1.34x and its peer group’s average of 1.77x. At first glance, this premium might look unjustified unless you expect extraordinary growth or returns from the company’s assets.
This is where Simply Wall St’s “Fair Ratio” comes in. Unlike industry or peer averages, the Fair Ratio factors in NextDecade’s own growth prospects, profit margins, business risks, and size. By tailoring the multiple to the company’s specific profile, it gives a more grounded estimate of what the PB ratio should be right now for this stock.
Comparing the Fair Ratio to the current 6.14x multiple shows that the shares are trading at a significant premium. This suggests the stock is overvalued on this metric.
Result: OVERVALUED
 NasdaqCM:NEXT PB Ratio as at Oct 2025
PB ratios tell one story, but what if the real opportunity lies elsewhere? Discover companies where insiders are betting big on explosive growth.
Upgrade Your Decision Making: Choose your NextDecade Narrative
Earlier we mentioned that there is an even better way to understand valuation, so let’s introduce you to Narratives. A Narrative is your personalized story behind a company’s numbers, connecting your view of its future growth, earnings, and margins to a forecast and what is known as fair value. Narratives make investing more approachable because they let you build and update your own perspective. On Simply Wall St’s Community page, millions of investors are already using this simple tool.
With Narratives, you can easily compare your fair value with the current share price to help guide buy or sell decisions, and these forecasts instantly update as new information, like earnings reports or big news, arrives. This means your view always reflects the latest developments, giving you an edge in fast-moving markets. For NextDecade, one investor’s optimistic Narrative might value shares at $8.20 based on aggressive LNG expansion, while another’s more cautious outlook pegs fair value at just $1.30. Narratives empower you to identify which scenario fits your outlook, making smarter, more dynamic decisions possible.
Do you think there’s more to the story for NextDecade? Create your own Narrative to let the Community know!
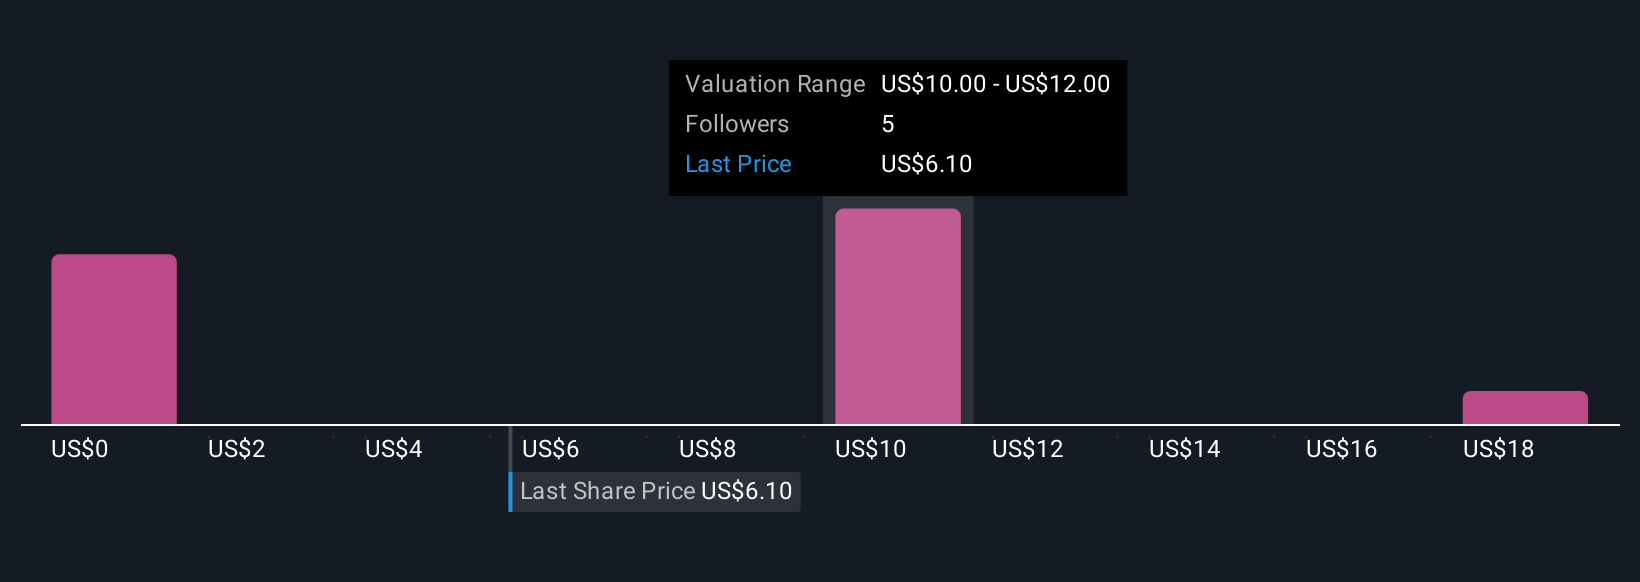 NasdaqCM:NEXT Community Fair Values as at Oct 2025
This article by Simply Wall St is general in nature. We provide commentary based on historical data
and analyst forecasts only using an unbiased methodology and our articles are not intended to be financial advice. It does not constitute a recommendation to buy or sell any stock, and does not take account of your objectives, or your
financial situation. We aim to bring you long-term focused analysis driven by fundamental data.
Note that our analysis may not factor in the latest price-sensitive company announcements or qualitative material.
Simply Wall St has no position in any stocks mentioned.
Discover if NextDecade might be undervalued or overvalued with our detailed analysis, featuring fair value estimates, potential risks, dividends, insider trades, and its financial condition.
Have feedback on this article? Concerned about the content? Get in touch with us directly. Alternatively, email editorial-team@simplywallst.com