
So, you are looking at QUALCOMM and wondering what all the recent buzz means for the stock’s value, and whether now is the right time to buy, hold, or look elsewhere. You are not alone. Over the past week, QUALCOMM shares have jumped 6.4%, bouncing back from a slightly negative performance in the last month. Zoom out, and the five-year chart shows solid gains of 41.1%, but the last twelve months have been choppy, with the stock losing 2.2% over the period. These swings have stemmed partly from headline-making developments. Recently, QUALCOMM’s acquisition of Autotalks drew the attention of Chinese regulators who launched an antitrust probe, adding near-term uncertainty and risk to the mix. Meanwhile, in the longer term, QUALCOMM has been making significant moves aimed at boosting its edge, such as adopting the latest Arm technology to deliver stronger AI performance and remaining central in global supply chain and geopolitical discussions.
With so much changing around it, the question becomes: is QUALCOMM undervalued or overvalued at just over $163 per share? If you love numbers, you will appreciate that on a strict valuation basis, looking at six separate checks, QUALCOMM passes in four, earning it a valuation score of 4. That can be a sign that the market might be missing some upside, but before you make any decisions, let us take a closer look at how those valuation scores stack up. And, continue reading to the end for a sharper way to cut through the noise and truly judge whether QUALCOMM represents a smart buy.
Why QUALCOMM is lagging behind its peers
Approach 1: QUALCOMM Discounted Cash Flow (DCF) Analysis
The Discounted Cash Flow (DCF) model works by projecting a company’s future cash flows and discounting them back to today’s value, assessing what those future dollars are worth in today’s terms. For QUALCOMM, the latest reported Free Cash Flow sits at $11.25 billion, and analysts predict steady growth over the next five years. In fact, projections anticipate Free Cash Flow will reach around $16.32 billion by fiscal year 2029, with further incremental growth derived from continued innovation and efficiency gains. Importantly, while analysts provide FCF estimates only up to 2029, Simply Wall St extrapolates the following years using moderate growth rates, pointing to continued strength in the business’s cash-generating ability.
Based on these projections, the DCF model calculates QUALCOMM’s intrinsic value at $195.67 per share. Set against the current trading price just above $163, this model points to a substantial 16.5% discount, suggesting the stock is meaningfully undervalued according to its cash flow potential.
Result: UNDERVALUED
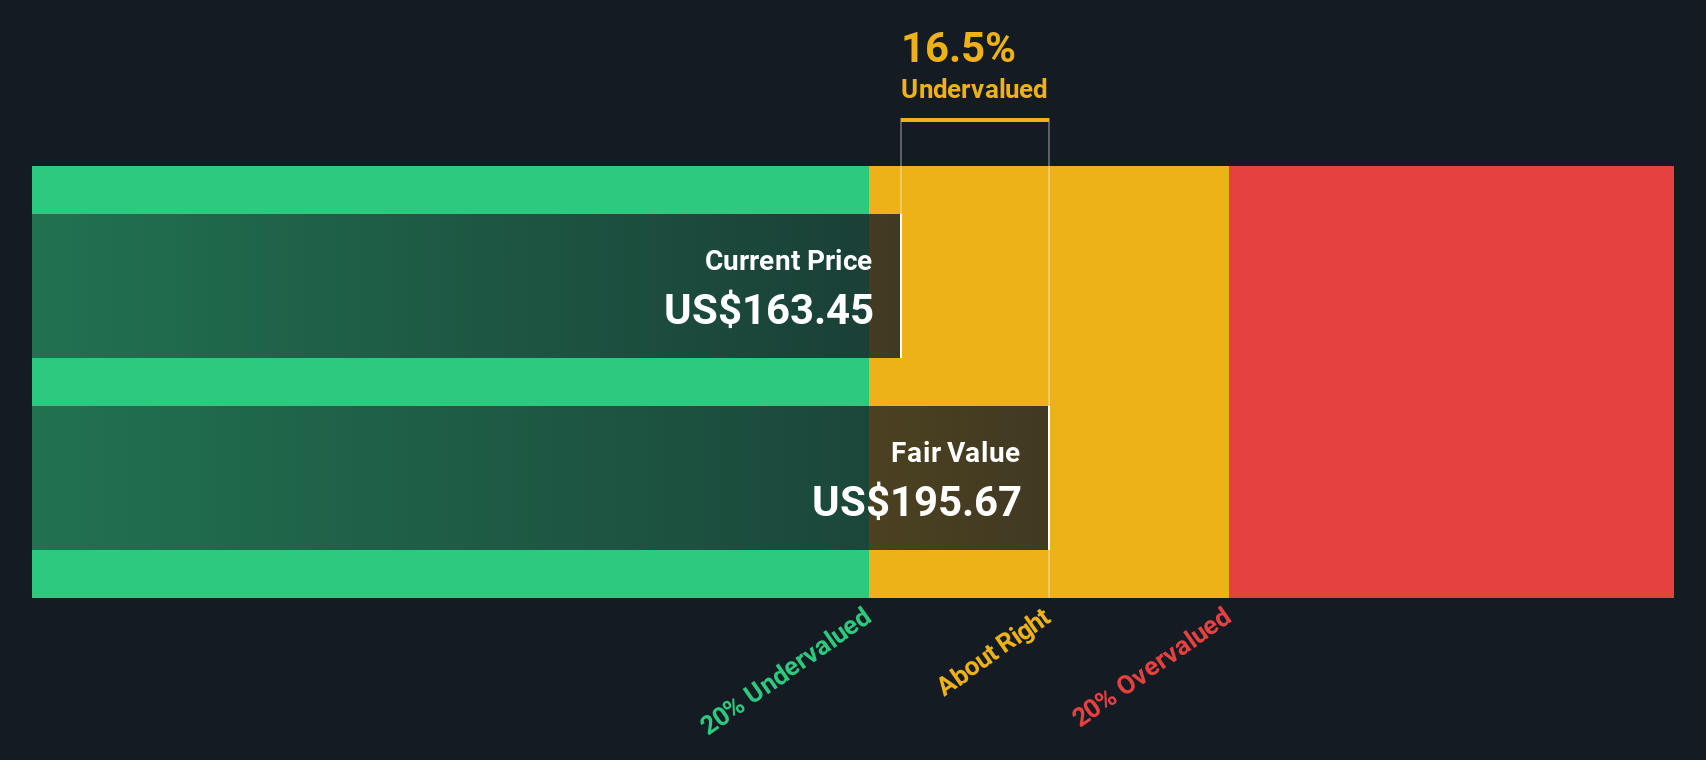 QCOM Discounted Cash Flow as at Oct 2025
Our Discounted Cash Flow (DCF) analysis suggests QUALCOMM is undervalued by 16.5%. Track this in your watchlist or portfolio, or discover more undervalued stocks.
Approach 2: QUALCOMM Price vs Earnings
The Price-to-Earnings (PE) ratio is a popular valuation metric for profitable companies like QUALCOMM because it ties the company’s stock price directly to its underlying earnings performance. In general, a higher growth outlook or lower perceived risk can justify a higher PE ratio. On the other hand, slow growth or higher risk can pull the ratio lower. What is considered “normal” can vary widely depending on a company’s prospects and the broader market environment.
QUALCOMM currently trades at a PE ratio of 15.2x. For context, the average PE ratio for the broader semiconductor industry is 35.9x. QUALCOMM’s selected peers average a much higher 64.6x. At first glance, this suggests QUALCOMM is priced more conservatively than many of its competitors.
However, looking solely at industry or peer averages can be misleading, since these benchmarks may not factor in the unique elements that drive QUALCOMM’s business, such as its growth rates, profit margins, and risk profile. This is where Simply Wall St’s proprietary “Fair Ratio” comes in. The Fair Ratio adjusts for those key factors and, for QUALCOMM, is calculated at 27.4x. This figure takes a broader set of data into account and gives investors a more grounded sense of what a reasonable PE multiple would be for the stock.
Comparing QUALCOMM’s current PE to its Fair Ratio, the stock is priced well below what would typically be expected given its characteristics. This suggests there could be hidden value that is overlooked by the market.
Result: UNDERVALUED
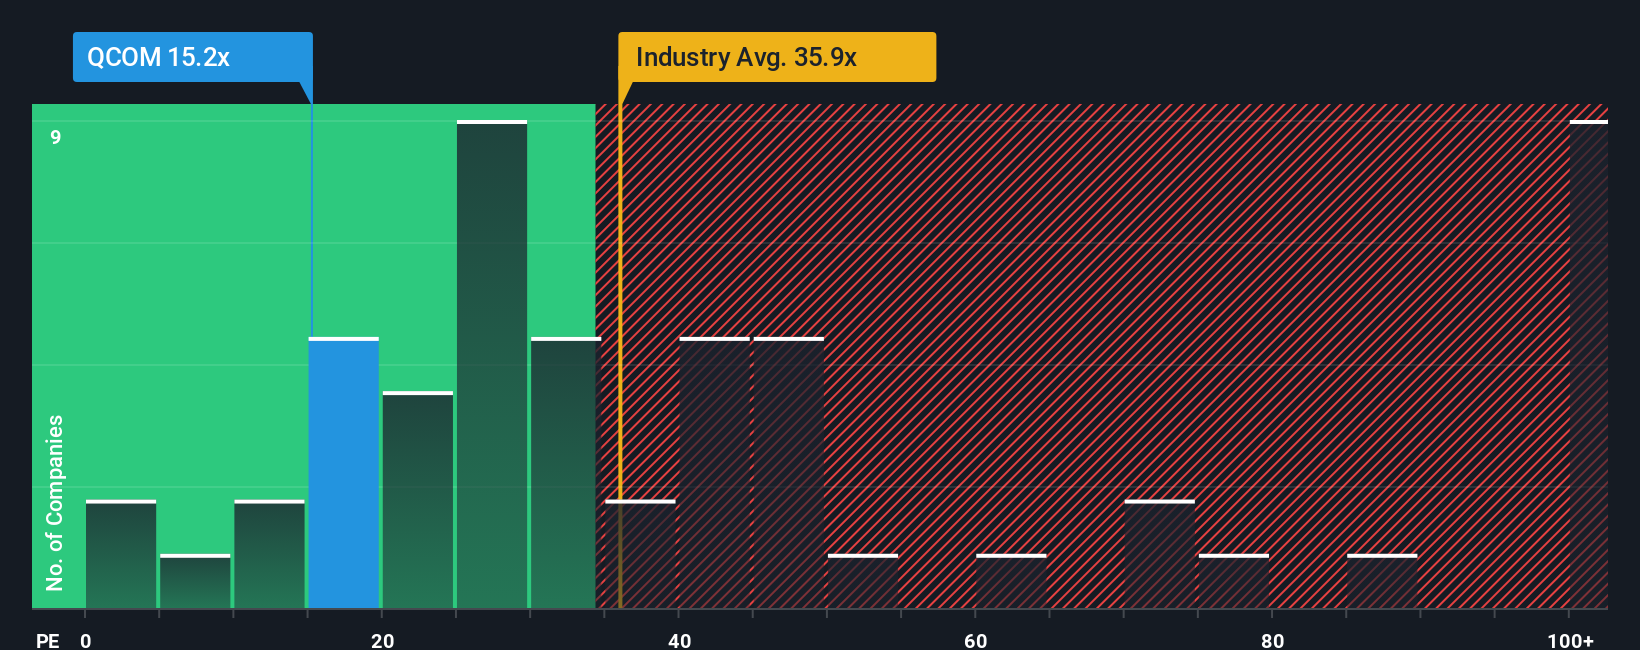 NasdaqGS:QCOM PE Ratio as at Oct 2025
PE ratios tell one story, but what if the real opportunity lies elsewhere? Discover companies where insiders are betting big on explosive growth.
Upgrade Your Decision Making: Choose your QUALCOMM Narrative
Earlier we mentioned there is an even better way to understand valuation, so let us introduce you to Narratives. A Narrative is your unique, data-backed investment story for a company. It is where your expectations for QUALCOMM’s future revenue, earnings, margins, and risk are spelled out, and where you connect your perspective on the company’s potential to a transparent financial forecast and resulting fair value.
With Narratives on Simply Wall St’s Community page, millions of investors can easily build and share their outlooks. You set your fair value, adjust your estimates if new news or earnings drop, and instantly see how your view compares to today’s share price. Narratives are updated dynamically as fresh information is published, helping you make smarter buy or sell decisions based on what you really believe.
For example, some QUALCOMM investors believe its leadership in AI hardware and strong FY2025 results mean fair value is as high as $300 per share, while others point to regulatory and market risks, seeing a fair value closer to $140. Narratives put these perspectives side by side, letting you decide which story aligns best with your investing convictions.
Do you think there’s more to the story for QUALCOMM? Create your own Narrative to let the Community know!
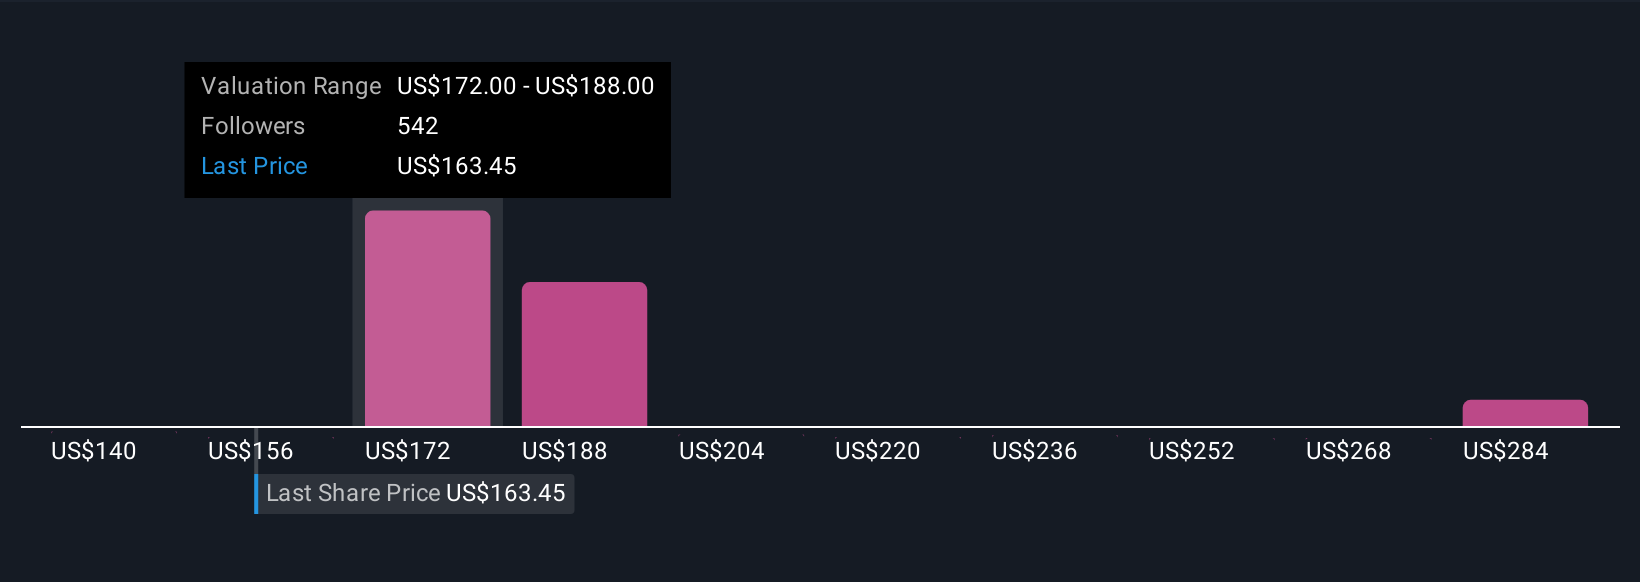 NasdaqGS:QCOM Community Fair Values as at Oct 2025
This article by Simply Wall St is general in nature. We provide commentary based on historical data
and analyst forecasts only using an unbiased methodology and our articles are not intended to be financial advice. It does not constitute a recommendation to buy or sell any stock, and does not take account of your objectives, or your
financial situation. We aim to bring you long-term focused analysis driven by fundamental data.
Note that our analysis may not factor in the latest price-sensitive company announcements or qualitative material.
Simply Wall St has no position in any stocks mentioned.
Discover if QUALCOMM might be undervalued or overvalued with our detailed analysis, featuring fair value estimates, potential risks, dividends, insider trades, and its financial condition.
Have feedback on this article? Concerned about the content? Get in touch with us directly. Alternatively, email editorial-team@simplywallst.com