
Oct 20, 2025
IndexBox has just published a new report: U.S. – Crude Coconut (Copra) Oil – Market Analysis, Forecast, Size, Trends And Insights.
The US crude coconut oil market experienced a slight contraction in consumption volume to 165K tons in 2024, while its value rose to $215M. Driven by rising demand, the market is forecast for a slight upward trend, with a projected volume of 181K tons and a value of $278M by 2035. The Philippines is the dominant import source, accounting for 95% of imports, while exports saw a significant rebound of 134% in 2024, primarily to Mexico. Import prices averaged $1,315 per ton, and export prices were significantly higher at $3,218 per ton, reflecting different market dynamics for incoming and outgoing crude coconut oil.
Key Findings
US market volume is forecast to grow to 181K tons by 2035, while market value is projected to reach $278MThe Philippines is the near-exclusive import source, supplying 95% of US crude coconut oil importsUS exports surged by 134% in 2024, with Mexico being the primary destinationAverage import price was $1,315 per ton, significantly lower than the average export price of $3,218 per tonMarket consumption peaked in 2014 at 254K tons and has since shown a noticeable slumpMarket Forecast
Driven by rising demand for crude coconut oil in the United States, the market is expected to start an upward consumption trend over the next decade. The performance of the market is forecast to increase slightly, with an anticipated CAGR of +0.9% for the period from 2024 to 2035, which is projected to bring the market volume to 181K tons by the end of 2035.
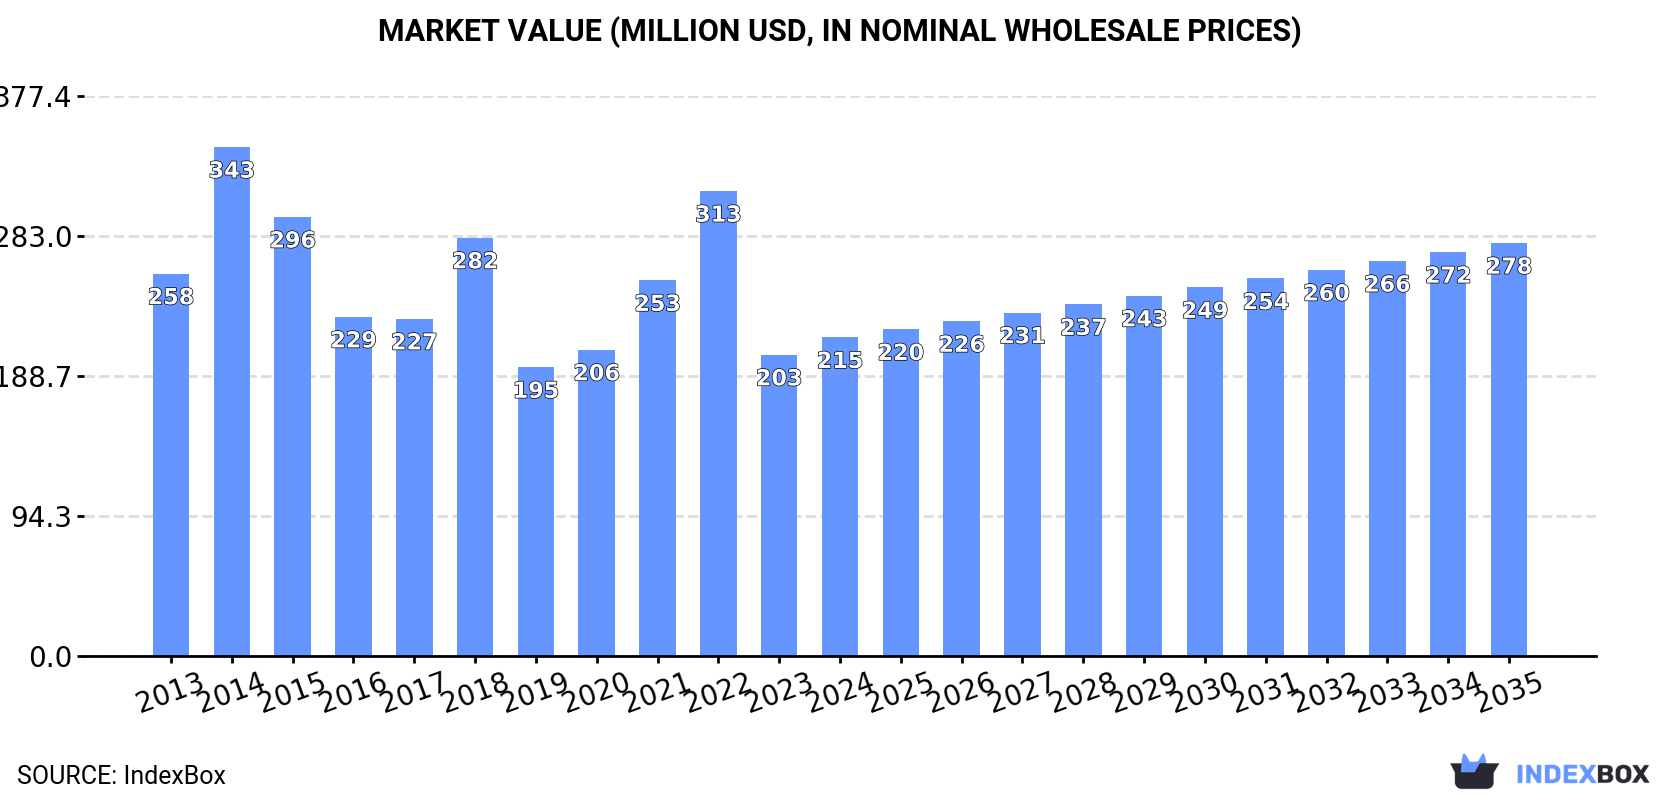
In value terms, the market is forecast to increase with an anticipated CAGR of +2.4% for the period from 2024 to 2035, which is projected to bring the market value to $278M (in nominal wholesale prices) by the end of 2035.
 ConsumptionUnited States’s Consumption of Crude Coconut (Copra) Oil
In 2024, the amount of crude coconut (copra) oil consumed in the United States contracted slightly to 165K tons, shrinking by -2.2% compared with 2023. Over the period under review, consumption showed a noticeable slump. Over the period under review, consumption reached the peak volume at 254K tons in 2014; however, from 2015 to 2024, consumption stood at a somewhat lower figure.
The value of the crude coconut oil market in the United States stood at $215M in 2024, rising by 5.8% against the previous year. This figure reflects the total revenues of producers and importers (excluding logistics costs, retail marketing costs, and retailers’ margins, which will be included in the final consumer price). In general, consumption continues to indicate a mild contraction. As a result, consumption attained the peak level of $343M. From 2015 to 2024, the growth of the market remained at a lower figure.
ImportsUnited States’s Imports of Crude Coconut (Copra) Oil
In 2024, approx. 169K tons of crude coconut (copra) oil were imported into the United States; flattening at 2023. Overall, imports showed a pronounced curtailment. The most prominent rate of growth was recorded in 2018 with an increase of 29%. Over the period under review, imports attained the maximum at 263K tons in 2014; however, from 2015 to 2024, imports stood at a somewhat lower figure.
In value terms, crude coconut oil imports expanded remarkably to $222M in 2024. Over the period under review, imports continue to indicate a relatively flat trend pattern. The most prominent rate of growth was recorded in 2014 with an increase of 64% against the previous year. As a result, imports reached the peak of $368M. From 2015 to 2024, the growth of imports remained at a somewhat lower figure.
Imports By Country
In 2024, the Philippines (160K tons) was the main supplier of crude coconut oil to the United States, with a 95% share of total imports. Moreover, crude coconut oil imports from the Philippines exceeded the figures recorded by the second-largest supplier, Indonesia (5.5K tons), more than tenfold.
From 2013 to 2024, the average annual growth rate of volume from the Philippines was relatively modest. The remaining supplying countries recorded the following average annual rates of imports growth: Indonesia (-20.7% per year) and Malaysia (-42.2% per year).
In value terms, the Philippines ($203M) constituted the largest supplier of crude coconut (copra) oil to the United States, comprising 91% of total imports. The second position in the ranking was held by Indonesia ($6.8M), with a 3.1% share of total imports.
From 2013 to 2024, the average annual rate of growth in terms of value from the Philippines totaled +2.4%. The remaining supplying countries recorded the following average annual rates of imports growth: Indonesia (-17.7% per year) and Malaysia (-30.6% per year).
Import Prices By Country
In 2024, the average crude coconut oil import price amounted to $1,315 per ton, rising by 16% against the previous year. Over the period under review, import price indicated a moderate expansion from 2013 to 2024: its price increased at an average annual rate of +3.4% over the last eleven-year period. The trend pattern, however, indicated some noticeable fluctuations being recorded throughout the analyzed period. Based on 2024 figures, crude coconut oil import price decreased by -27.6% against 2022 indices. The growth pace was the most rapid in 2021 an increase of 63% against the previous year. The import price peaked at $1,816 per ton in 2022; however, from 2023 to 2024, import prices failed to regain momentum.
Prices varied noticeably by country of origin: amid the top importers, the country with the highest price was Malaysia ($6,481 per ton), while the price for Indonesia ($1,247 per ton) was amongst the lowest.
From 2013 to 2024, the most notable rate of growth in terms of prices was attained by Malaysia (+20.1%), while the prices for the other major suppliers experienced more modest paces of growth.
ExportsUnited States’s Exports of Crude Coconut (Copra) Oil
After two years of decline, overseas shipments of crude coconut (copra) oil increased by 134% to 3.9K tons in 2024. In general, exports, however, showed a abrupt downturn. The growth pace was the most rapid in 2015 when exports increased by 214%. Over the period under review, the exports reached the maximum at 32K tons in 2016; however, from 2017 to 2024, the exports stood at a somewhat lower figure.
In value terms, crude coconut oil exports surged to $13M in 2024. Overall, exports recorded a remarkable increase. The most prominent rate of growth was recorded in 2015 when exports increased by 227% against the previous year. The exports peaked at $26M in 2016; however, from 2017 to 2024, the exports remained at a lower figure.
Exports By Country
Mexico (3K tons) was the main destination for crude coconut oil exports from the United States, with a 76% share of total exports. Moreover, crude coconut oil exports to Mexico exceeded the volume sent to the second major destination, Canada (705 tons), fourfold. China (26 tons) ranked third in terms of total exports with a 0.7% share.
From 2013 to 2024, the average annual growth rate of volume to Mexico stood at +2.6%. Exports to the other major destinations recorded the following average annual rates of exports growth: Canada (-10.4% per year) and China (-31.3% per year).
In value terms, Mexico ($9.1M) emerged as the key foreign market for crude coconut (copra) oil exports from the United States, comprising 73% of total exports. The second position in the ranking was held by Canada ($2.4M), with a 19% share of total exports. It was followed by China, with a 1% share.
From 2013 to 2024, the average annual growth rate of value to Mexico totaled +14.2%. Exports to the other major destinations recorded the following average annual rates of exports growth: Canada (+1.9% per year) and China (-19.4% per year).
Export Prices By Country
The average crude coconut oil export price stood at $3,218 per ton in 2024, falling by -6.2% against the previous year. Over the period under review, the export price, however, enjoyed resilient growth. The most prominent rate of growth was recorded in 2018 when the average export price increased by 168%. Over the period under review, the average export prices hit record highs at $4,463 per ton in 2020; however, from 2021 to 2024, the export prices stood at a somewhat lower figure.
Prices varied noticeably by country of destination: amid the top suppliers, the country with the highest price was South Korea ($6,984 per ton), while the average price for exports to Mexico ($3,077 per ton) was amongst the lowest.
From 2013 to 2024, the most notable rate of growth in terms of prices was recorded for supplies to South Korea (+21.3%), while the prices for the other major destinations experienced more modest paces of growth.