
Oct 21, 2025
IndexBox has just published a new report: EU – Graphic Papers – Market Analysis, Forecast, Size, Trends and Insights.
This article provides a comprehensive analysis of the European Union’s graphic papers market, covering the period from 2013 to 2024 with a forecast extending to 2035. In 2024, the market showed signs of recovery, with consumption reaching 18 million tons and market value soaring to $20.7 billion, ending a two-year declining trend. However, the market has contracted significantly from its 2015 peak of 26 million tons. Germany is the largest consumer and producer, followed by Italy and France. The market is dominated by printing and writing paper, which constitutes over 80% of consumption and production. Both imports and exports have seen substantial declines over the past decade. The market is forecast to grow at a CAGR of +1.4% in volume and +2.5% in value until 2035, reaching 22 million tons and $27.2 billion, respectively.
Key Findings
Market forecast to grow at a CAGR of +1.4% in volume and +2.5% in value, reaching 22M tons and $27.2B by 2035Germany is the dominant market player, accounting for 25% of consumption and leading in productionPrinting and writing paper constitutes the vast majority (approx. 84-89%) of the market’s volume and valueBoth imports and exports have significantly declined since their 2013 peaks, falling by nearly 50% in volumeMarket prices showed resilience, with import and export prices increasing at an average annual rate of +1.7% and +2.3%, respectively, from 2013-2024Market Forecast
Driven by rising demand for graphic papers in the European Union, the market is expected to start an upward consumption trend over the next decade. The performance of the market is forecast to increase slightly, with an anticipated CAGR of +1.4% for the period from 2024 to 2035, which is projected to bring the market volume to 22M tons by the end of 2035.
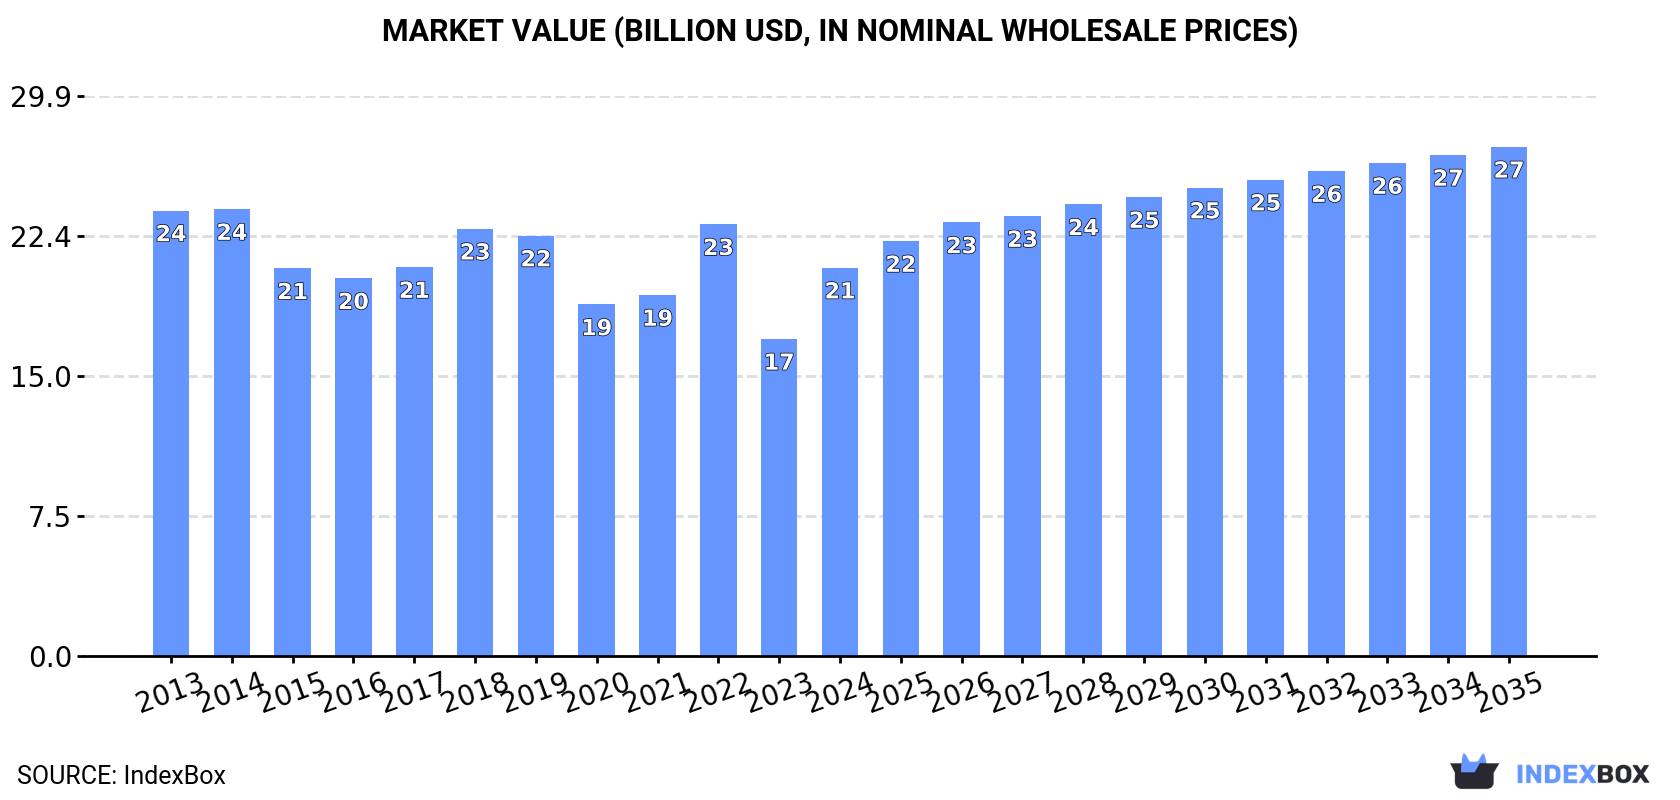
In value terms, the market is forecast to increase with an anticipated CAGR of +2.5% for the period from 2024 to 2035, which is projected to bring the market value to $27.2B (in nominal wholesale prices) by the end of 2035.
 ConsumptionEuropean Union’s Consumption of Graphic Papers
In 2024, consumption of graphic papers was finally on the rise to reach 18M tons for the first time since 2021, thus ending a two-year declining trend. In general, consumption, however, showed a pronounced contraction. Over the period under review, consumption reached the peak volume at 26M tons in 2015; however, from 2016 to 2024, consumption remained at a lower figure.
The size of the graphic papers market in the European Union soared to $20.7B in 2024, with an increase of 22% against the previous year. This figure reflects the total revenues of producers and importers (excluding logistics costs, retail marketing costs, and retailers’ margins, which will be included in the final consumer price). Overall, consumption, however, continues to indicate a mild curtailment. Over the period under review, the market hit record highs at $23.9B in 2014; however, from 2015 to 2024, consumption remained at a lower figure.
Consumption By Country
Germany (4.6M tons) remains the largest graphic papers consuming country in the European Union, comprising approx. 25% of total volume. Moreover, graphic papers consumption in Germany exceeded the figures recorded by the second-largest consumer, Italy (1.9M tons), twofold. France (1.5M tons) ranked third in terms of total consumption with an 8.2% share.
From 2013 to 2024, the average annual growth rate of volume in Germany amounted to -5.0%. In the other countries, the average annual rates were as follows: Italy (-2.4% per year) and France (-6.9% per year).
In value terms, Germany ($5.4B) led the market, alone. The second position in the ranking was taken by Italy ($2.4B). It was followed by France.
In Germany, the graphic papers market shrank by an average annual rate of -2.3% over the period from 2013-2024. The remaining consuming countries recorded the following average annual rates of market growth: Italy (+0.5% per year) and France (-6.0% per year).
The countries with the highest levels of graphic papers per capita consumption in 2024 were Finland (259 kg per person), Austria (131 kg per person) and Sweden (121 kg per person).
From 2013 to 2024, the biggest increases were recorded for Belgium (with a CAGR of +4.5%), while consumption for the other leaders experienced more modest paces of growth.
Consumption By Type
Printing and writing paper (16M tons) constituted the product with the largest volume of consumption, comprising approx. 84% of total volume. Moreover, printing and writing paper exceeded the figures recorded for the second-largest type, newsprint (3M tons), fivefold.
For printing and writing paper, consumption plunged by an average annual rate of -2.3% over the period from 2013-2024.
In value terms, printing and writing paper ($18.4B) led the market, alone. The second position in the ranking was held by newsprint ($2.4B).
For printing and writing paper, market remained relatively stable over the period from 2013-2024.
ProductionEuropean Union’s Production of Graphic Papers
In 2024, production of graphic papers increased by 20% to 21M tons for the first time since 2021, thus ending a two-year declining trend. In general, production, however, continues to indicate a perceptible contraction. Over the period under review, production reached the peak volume at 37M tons in 2013; however, from 2014 to 2024, production stood at a somewhat lower figure.
In value terms, graphic papers production skyrocketed to $23.8B in 2024 estimated in export price. Overall, production, however, showed a noticeable slump. The level of production peaked at $34.1B in 2013; however, from 2014 to 2024, production failed to regain momentum.
Production By Country
The countries with the highest volumes of production in 2024 were Germany (5M tons), Finland (3.2M tons) and Sweden (2.5M tons), with a combined 50% share of total production. Austria, Italy, Spain, Belgium, Portugal and the Netherlands lagged somewhat behind, together comprising a further 39%.
From 2013 to 2024, the most notable rate of growth in terms of production, amongst the main producing countries, was attained by Belgium (with a CAGR of +2.7%), while production for the other leaders experienced a decline in the production figures.
Production By Type
Printing and writing paper (19M tons) constituted the product with the largest volume of production, comprising approx. 89% of total volume. Moreover, printing and writing paper exceeded the figures recorded for the second-largest type, newsprint (2.5M tons), eightfold.
From 2013 to 2024, the average annual rate of growth in terms of the volume of printing and writing paper production stood at -4.2%.
In value terms, printing and writing paper ($24B) led the market, alone. The second position in the ranking was taken by newsprint ($2B).
From 2013 to 2024, the average annual rate of growth in terms of the value of printing and writing paper production totaled -1.8%.
ImportsEuropean Union’s Imports of Graphic Papers
For the third year in a row, the European Union recorded decline in overseas purchases of graphic papers, which decreased by -18.1% to 9.8M tons in 2024. In general, imports saw a deep setback. The growth pace was the most rapid in 2021 when imports increased by 1.7%. The volume of import peaked at 20M tons in 2013; however, from 2014 to 2024, imports remained at a lower figure.
In value terms, graphic papers imports shrank dramatically to $11.3B in 2024. Over the period under review, imports recorded a pronounced shrinkage. The most prominent rate of growth was recorded in 2022 when imports increased by 26% against the previous year. The level of import peaked at $18.9B in 2013; however, from 2014 to 2024, imports remained at a lower figure.
Imports By Country
In 2024, Germany (2.2M tons), distantly followed by France (1,304K tons), Italy (1,065K tons), Poland (758K tons), Spain (755K tons), Belgium (653K tons) and the Netherlands (591K tons) represented the major importers of graphic papers, together comprising 75% of total imports. The Czech Republic (404K tons), Sweden (292K tons) and Austria (221K tons) followed a long way behind the leaders.
From 2013 to 2024, the most notable rate of growth in terms of purchases, amongst the main importing countries, was attained by Sweden (with a CAGR of -1.1%), while imports for the other leaders experienced a decline in the imports figures.
In value terms, Germany ($2.4B), France ($1.5B) and Italy ($1.1B) appeared to be the countries with the highest levels of imports in 2024, with a combined 45% share of total imports. Spain, Poland, the Netherlands, Belgium, the Czech Republic, Sweden and Austria lagged somewhat behind, together accounting for a further 38%.
In terms of the main importing countries, the Czech Republic, with a CAGR of -0.1%, saw the highest growth rate of the value of imports, over the period under review, while purchases for the other leaders experienced a decline in the imports figures.
Imports By Type
Printing and writing paper was the major type of graphic papers in the European Union, with the volume of imports accounting for 8M tons, which was approx. 81% of total imports in 2024. It was distantly followed by newsprint (1.8M tons), generating a 19% share of total imports.
Printing and writing paper was also the fastest-growing in terms of imports, with a CAGR of -6.1% from 2013 to 2024. newsprint (-6.4%) illustrated a downward trend over the same period. The shares of the largest types remained relatively stable throughout the analyzed period.
In value terms, printing and writing paper ($10B) constitutes the largest type of graphic papers imported in the European Union, comprising 88% of total imports. The second position in the ranking was held by newsprint ($1.3B), with a 12% share of total imports.
From 2013 to 2024, the average annual rate of growth in terms of the value of printing and writing paper imports amounted to -4.4%.
Import Prices By Type
The import price in the European Union stood at $1,156 per ton in 2024, waning by -5.3% against the previous year. Import price indicated a mild increase from 2013 to 2024: its price increased at an average annual rate of +1.7% over the last eleven years. The trend pattern, however, indicated some noticeable fluctuations being recorded throughout the analyzed period. Based on 2024 figures, graphic papers import price increased by +40.8% against 2020 indices. The most prominent rate of growth was recorded in 2022 when the import price increased by 31% against the previous year. The level of import peaked at $1,220 per ton in 2023, and then dropped in the following year.
There were significant differences in the average prices amongst the major imported products. In 2024, the product with the highest price was printing and writing paper ($1,252 per ton), while the price for newsprint stood at $734 per ton.
From 2013 to 2024, the most notable rate of growth in terms of prices was attained by printing and writing paper (+1.8%).
Import Prices By Country
The import price in the European Union stood at $1,156 per ton in 2024, declining by -5.3% against the previous year. Import price indicated a slight expansion from 2013 to 2024: its price increased at an average annual rate of +1.7% over the last eleven years. The trend pattern, however, indicated some noticeable fluctuations being recorded throughout the analyzed period. Based on 2024 figures, graphic papers import price increased by +40.8% against 2020 indices. The growth pace was the most rapid in 2022 when the import price increased by 31% against the previous year. The level of import peaked at $1,220 per ton in 2023, and then dropped in the following year.
Average prices varied somewhat amongst the major importing countries. In 2024, major importing countries recorded the following prices: in Spain ($1,261 per ton) and the Netherlands ($1,251 per ton), while Sweden ($995 per ton) and Italy ($1,065 per ton) were amongst the lowest.
From 2013 to 2024, the most notable rate of growth in terms of prices was attained by the Czech Republic (+2.3%), while the other leaders experienced more modest paces of growth.
ExportsEuropean Union’s Exports of Graphic Papers
For the third consecutive year, the European Union recorded decline in shipments abroad of graphic papers, which decreased by -16.3% to 13M tons in 2024. In general, exports continue to indicate a deep contraction. The growth pace was the most rapid in 2021 when exports increased by 7.8%. The volume of export peaked at 31M tons in 2013; however, from 2014 to 2024, the exports stood at a somewhat lower figure.
In value terms, graphic papers exports fell dramatically to $15B in 2024. Over the period under review, exports recorded a abrupt shrinkage. The most prominent rate of growth was recorded in 2022 with an increase of 20% against the previous year. Over the period under review, the exports attained the maximum at $28.2B in 2013; however, from 2014 to 2024, the exports remained at a lower figure.
Exports By Country
In 2024, Germany (2.6M tons), Finland (1.8M tons), Sweden (1.5M tons), Portugal (1.2M tons), Austria (0.9M tons), Belgium (0.9M tons), Spain (0.9M tons), Italy (0.7M tons) and France (0.5M tons) represented the main exporter of graphic papers in the European Union, achieving 87% of total export.
From 2013 to 2024, the biggest increases were recorded for Portugal (with a CAGR of -1.9%), while shipments for the other leaders experienced a decline in the exports figures.
In value terms, the largest graphic papers supplying countries in the European Union were Germany ($3.3B), Finland ($1.8B) and Sweden ($1.5B), with a combined 44% share of total exports. Portugal, Italy, Austria, Spain, Belgium and France lagged somewhat behind, together comprising a further 42%.
Portugal, with a CAGR of -0.9%, saw the highest rates of growth with regard to the value of exports, among the main exporting countries over the period under review, while shipments for the other leaders experienced a decline in the exports figures.
Exports By Type
Printing and writing paper prevails in exports structure, resulting at 11M tons, which was near 90% of total exports in 2024. It was distantly followed by newsprint (1.2M tons), comprising a 9.8% share of total exports.
Printing and writing paper was also the fastest-growing in terms of exports, with a CAGR of -7.3% from 2013 to 2024. newsprint (-10.6%) illustrated a downward trend over the same period. Printing and writing paper (+4.1 p.p.) significantly strengthened its position in terms of the total exports, while newsprint saw its share reduced by -4.1% from 2013 to 2024, respectively.
In value terms, printing and writing paper ($14.1B) remains the largest type of graphic papers supplied in the European Union, comprising 94% of total exports. The second position in the ranking was held by newsprint ($853M), with a 5.7% share of total exports.
From 2013 to 2024, the average annual rate of growth in terms of the value of printing and writing paper exports totaled -5.2%.
Export Prices By Type
In 2024, the export price in the European Union amounted to $1,181 per ton, reducing by -3.4% against the previous year. Export price indicated a measured increase from 2013 to 2024: its price increased at an average annual rate of +2.3% over the last eleven years. The trend pattern, however, indicated some noticeable fluctuations being recorded throughout the analyzed period. The growth pace was the most rapid in 2022 when the export price increased by 37% against the previous year. Over the period under review, the export prices attained the maximum at $1,223 per ton in 2023, and then fell modestly in the following year.
Prices varied noticeably by the product type; the product with the highest price was printing and writing paper ($1,235 per ton), while the average price for exports of newsprint totaled $685 per ton.
From 2013 to 2024, the most notable rate of growth in terms of prices was attained by printing and writing paper (+2.3%).
Export Prices By Country
The export price in the European Union stood at $1,181 per ton in 2024, declining by -3.4% against the previous year. Export price indicated notable growth from 2013 to 2024: its price increased at an average annual rate of +2.3% over the last eleven years. The trend pattern, however, indicated some noticeable fluctuations being recorded throughout the analyzed period. The growth pace was the most rapid in 2022 when the export price increased by 37%. The level of export peaked at $1,223 per ton in 2023, and then contracted in the following year.
Prices varied noticeably by country of origin: amid the top suppliers, the country with the highest price was Italy ($1,563 per ton), while Belgium ($986 per ton) was amongst the lowest.
From 2013 to 2024, the most notable rate of growth in terms of prices was attained by Italy (+3.6%), while the other leaders experienced more modest paces of growth.