
The spatiotemporal variabilities and trends of temperature and precipitation during the main growing season (1995–2018) are presented in Fig. 3 (see also Supplementary Table 3). Temperature variability, expressed as the coefficient of variation (CV), showed distinct spatial patterns across AZs (Fig. 3A). The highest variability (CV up to 0.11) occurred in parts of northeastern and southeastern Ethiopia, particularly in Central Tigray, Bale, and Borena AZs. In contrast, temperature was the least variable (CV as low as 0.01) in the western areas. Variability of temperature was generally higher in the most recent years (late 2000s and 2010s) than in former periods (see Supplementary Figs. 3 and 4).
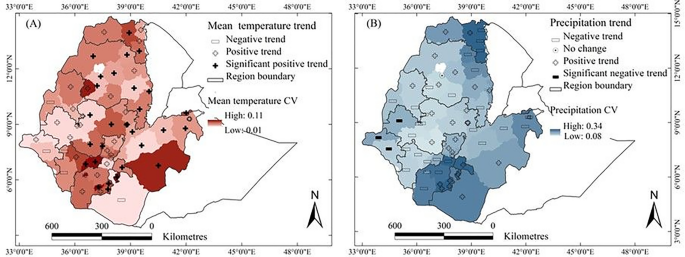
Coefficient of variations (CVs) and trends for growing season average air temperature (A) and total precipitation (B) for the administrative zones in the main crop-growing areas of Ethiopia 1995–2018. White zones denote areas where the crops of interest are not grown or where no data were available. Trends are represented by ‘ + ’ for increases, ‘ − ’ for decreases, and ‘⊙’ for no change, where the bold type indicates that the trend was significant at the 95% confidence level. The value of the CV is indicated by the colour scale.
Temperature trends were largely positive across the country during the growing season (see Supplementary Tables 1 and 3 for weather stations and AZs, respectively). Warming rates ranged from + 0.83 °C per decade in AZs such as Central Tigray, West Gojjam, and Dawuro, to a cooling of − 0.58 °C per decade in Borena and West Omo. The national average warming rate was + 0.31 °C per decade. These increasing trends were statistically significant (p
Precipitation variability also showed considerable spatial heterogeneity (Fig. 3B). The highest CVs (up to 0.34) were recorded in the southwestern and eastern parts of the country, including AZs like Eastern Tigray, Gamo, and parts of Eastern Oromia. In contrast, the northwestern and central highland AZs showed relatively low variability (CV as low as 0.08). Since the 1990s, precipitation variability has increased, especially in eastern and southern Ethiopia, marked by more frequent and intense rainfall anomalies (see Supplementary Figs. 3 and 4).
Precipitation trends, however, were more spatially variable and less consistent than temperature. The overall national trend in growing season precipitation was a decline of − 47.5 mm per decade. The highest positive trend (up to + 42 mm/decade) was observed in some western AZs, while the strongest negative trend (− 89 mm/decade) occurred in southeastern Ethiopia. Notably, no AZ exhibited a statistically significant positive precipitation trend. Three AZs showed significant negative trends. At the station level, 13 weather stations had significant declines, while eight stations showed negative but non-significant trends (see Supplementary Table 1).
In contrast to the broadly consistent and significantly increasing temperature trends, precipitation trends were more spatially fragmented and statistically weaker. This contrast suggests that while temperature is rising uniformly across Ethiopia, precipitation patterns are more complex. Importantly, areas experiencing negative precipitation trends often coincided with positive temperature trends, such as in Borena, Bale, and Eastern Oromia, indicating a compounding effect of warming and drying. Conversely, AZs with relatively stable or increasing precipitation, mainly in the west and southwest, tended to have lower temperature variability and more stable climates.
Variability and trends of crop yields
The interannual variability (CV) and trends in the yields of maize, sorghum, tef, and wheat were assessed across AZs in Ethiopia for the period 1995–2018 (Fig. 4, see also Supplementary Figs. 3 and 5). Additional analyses were conducted at the district level for 25 high-productivity areas identified by Warner et al.46, where consistent yield data were available for all four crops (Supplementary Table 2).
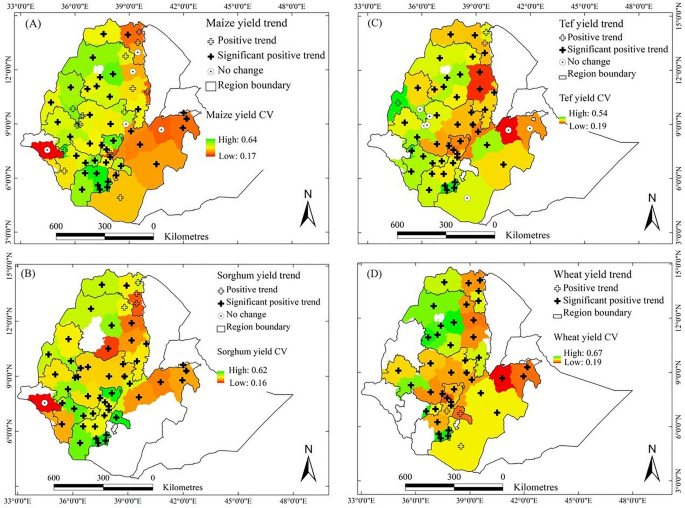
Trends and coefficients of variation (CVs) of the yields of maize (A), sorghum (B), tef (C), and wheat (D) for the administrative zones in the main crop-growing areas of Ethiopia for 1995–2018. White zones denote areas where the crops of interest are not grown or where no data were available. Trends are represented by ‘ + ’ for increases and ‘⊙’ for no change, where administrative zones with bold plus signs indicate that the trends were significant at the 95% confidence level. The value of the CV is indicated by the colour scale.
Maize yield variability (CV range: 0.17–0.64) was moderate to high across AZs (Fig. 4A). The lowest variability was observed in the high-yielding AZs of East Gojjam, North Gondar, West Wollega, and North Shewa. In contrast, higher variability occurred in parts of central and southern Ethiopia. A positive yield trend was detected in the majority of AZs, with many statistically significant increases particularly in western and southwestern regions. No AZ experienced yield declines. On a national scale, maize yields increased by an average of 154.4 kg/ha/year during the study period. At the district level, maize yield variability also varied substantially, with the highest variability recorded in Boset, Bore, Alaba, and Dembecha. Of the 25 high-productivity districts, 15 showed statistically significant upward trends in maize yields (p
Sorghum showed relatively high interannual variability, with CVs ranging from 0.16 to 0.62 (Fig. 4B). The northwestern and southern regions displayed particularly higher variability than in other areas of the country. Despite this, the average level of variability was comparable to that of maize. Positive yield trends were observed across nearly all AZs, with significant increases in parts of eastern and northern Ethiopia, notably in West Gojjam, which recorded the highest rate at 137 kg/ha/year. The national average annual increase of Sorghum was 94.9 kg/ha/year. At the district level, variability was highest in Meiso, Chilga, Kalu, and Gondar Zuriya. Nevertheless, 13 of the 25 districts experienced statistically significant increases in sorghum yield over time.
Tef had the lowest interannual yield variability among the four crops, with CVs ranging from 0.19 to 0.54 (Fig. 4C). Its yield variability was especially low in the western regions, suggesting more stable yields over time. Tef yields increased in almost all AZs, with positive trends observed across the crop-growing areas. Several AZs in central and northern Ethiopia, such as East and West Gojjam and North Shewa, showed significant yield improvements. The average national increase in tef yield was 60.6 kg/ha/year. At the district scale, although tef generally showed lower variability compared to maize and sorghum, relatively high variability was noted in Becho, Dejen, Lomme, and Dera. Positive trends were nonetheless widespread, with 11 districts showing statistically significant improvements in yield.
Wheat yield variability was the highest among all crops (CV range: 0.19–0.67), with elevated variability in eastern and southern AZs (Fig. 4D). Despite this, wheat yields increased consistently across most AZs, with the strongest and most statistically significant trends occurring in Western Tigray, Arsi, Bale, and Awi. Western Tigray recorded the highest increase, at 184 kg/ha/year, while the national average wheat yield increased by 97.3 kg/ha/year. At the district level, wheat yield variability was most pronounced in Sinana, Gimbichu, Wegera, and Baso Liben. Nonetheless, wheat yield trends were predominantly positive, with 14 districts showing statistically significant increases over the study period.
At the national level, average crop yields over the study period were 2799 kg/ha for maize, 2020 kg/ha for sorghum, 1317 kg/ha for tef, and 2068 kg/ha for wheat (Supplementary Fig. 5). The corresponding variabilities (standard deviations, SDs) were 753.2 kg/ha, 455.3 kg/ha, 290.8 kg/ha, and 474.5 kg/ha, respectively. From 1995 to 2018, national yield levels increased by 27% for maize, 22% for sorghum, 26% for tef, and 24% for wheat, indicating a generally upward trend across crops and time (Supplementary Fig. 6).
Overall, yield variability and trends revealed consistent geographic patterns. Western Ethiopia tended to exhibit lower variability and stronger positive trends, particularly for maize and wheat. In contrast, eastern and southern regions experienced higher interannual variability, especially for sorghum and wheat, although yield trends in these areas remained positive in most cases. Across the 25 high-productivity districts, maize and wheat displayed widespread and statistically significant improvements, while sorghum and tef also showed positive trends, albeit with greater variability in spatial distribution and year-to-year performance.
Covariation of crop yields and climatic factors
Climate factors often exhibit substantial interannual variability, making it essential to evaluate the sensitivity of crop yields to these climatic drivers. Sensitivity metrics provide valuable insights into how crop yields respond to unit changes in climate variables. Table 2 summarizes the average sensitivity of crop yields to growing season temperature, precipitation, and solar radiation based on first difference regression analyses.
The results indicate that maize yields are adversely affected by temperature increases. A 1 °C rise in growing season temperature corresponds to a 0.25% decrease in maize yield. This suggests that maize is particularly vulnerable to heat stress, likely due to its narrow optimal temperature range. In contrast, sorghum, tef, and wheat exhibit positive sensitivities to temperature, with yield increases of 0.05, 0.19, and 0.34% per °C, respectively. This indicates that these crops may benefit from moderate warming, potentially due to improved physiological activity or extended growing seasons in cooler highland areas.
Sensitivity to precipitation varies considerably across crops. Sorghum and tef show positive responses to increased precipitation, with sensitivities of 0.0016 and 0.0012% per mm, respectively. These findings suggest that these crops are more water-efficient and capable of utilizing additional rainfall to improve yields, especially in semi-arid regions. In contrast, maize and wheat show negative precipitation sensitivities (-0.0015 and -0.001% per mm), suggesting that excessive rainfall may either increase susceptibility to disease or waterlogging or reflect the timing mismatch between rainfall and critical crop stages.
The influence of solar radiation also differs markedly among crops. Increased radiation negatively affects maize and sorghum yields, with sensitivities of − 0.002 and − 0.007% per W/m2, respectively. This suggests that higher radiation levels may exacerbate evapotranspiration stress or lead to heat damage, especially in already warm environments. On the other hand, tef and wheat exhibit positive responses to increased radiation (0.009 and 0.002% per W/m2, respectively), suggesting that these crops are more capable of converting increased solar energy into biomass and yield under favourable moisture and temperature conditions.
We evaluated the extent to which climate accounted for the variability of yield to further illustrate the relationship between observed variations in crop yields and climatic variations. This extent is represented by the coefficients of determination, CD, within first-difference models specific to each AZ, highlighting the proportion of crop-yield variability that climatic variability could explain (Fig. 5). Climatic variability accounted for significant variations in crop yields across the main growing areas, encompassing 45, 40, 49, and 37% of the areas for growing maize, sorghum, tef and wheat, respectively. These areas collectively represented 41, 33, 54, and 43% of the average production of maize, sorghum, tef and wheat in the country, respectively.
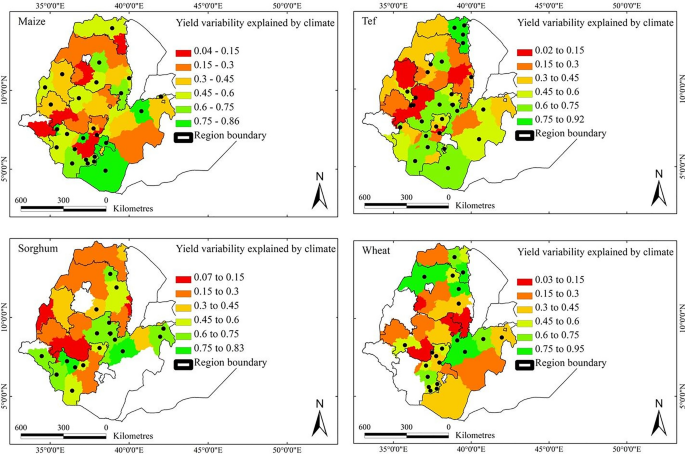
Variability of maize, sorghum, tef and wheat yields over 1995–2018 due to climatic variability in the main growing areas of Ethiopia. The values range from 0 to 1. A value of 1.0 implies that the entire variability was explained by climatic variability (CD, coefficient of determination). Dots denote the administrative zones where the relationship between climate and crop-yield variability is significant at the 95% confidence level. White zones denote areas where the crops of interest are not grown or where no data were available.
Climatic variability notably tended to account for a high proportion (> 60%) of the variations in maize yields, predominantly in the southern regions. The variability of sorghum yield due to climate was notably high (> 40%) across the growing areas, particularly in the south and southeast. The highest variability in tef yields associated with climate variability was primarily observed in the southern and northeastern growing regions. Similarly, interannual climatic variability accounted for a substantial portion of the variability in wheat yields, particularly in the northern and central parts of the main growing areas. On average, approximately 61, 63, 58, and 60% of the variations in maize, sorghum, tef, and wheat yields, respectively, were attributed to climatic variability amongst the AZs with significant relationships. Yet the extent to which climatic variability explained crop-yield variability varied greatly depending on specific locations and crops.
Impact of climatic trends on crop yield trendsRole of climatic factors in yield trends
The impacts of individual climatic factors on crop yield trends over the period 1995–2018 were assessed using a linear mixed-effects regression model (Eq. 1). The yield impact (%) of each individual climatic factor was quantified as the ratio of the yield trend attributed to that factor to the overall yield trend in each AZ. This metric provides insight into the relative contribution of each climatic factor to the yield trend in a given AZ compared to the overall AZ-specific yield trend.
Table 3 summarises the model results at AZ level, with corresponding district level outputs available in Supplementary Table 4. The findings highlight that quadratic terms of temperature and precipitation have substantial impacts on crop yields. Crop yields were positively or negatively affected by the trends of temperature and precipitation (Figs. 6 and 7). The patterns differed for the four crops (Supplementary Fig. 7) and in almost all AZ impacts are rather small (well below 10%). For maize and tef, the number of AZs with temperature-induced losses was greater than those positively affected. Conversely, for sorghum and wheat, the number of AZs with temperature-induced gains surpassed those negatively affected.
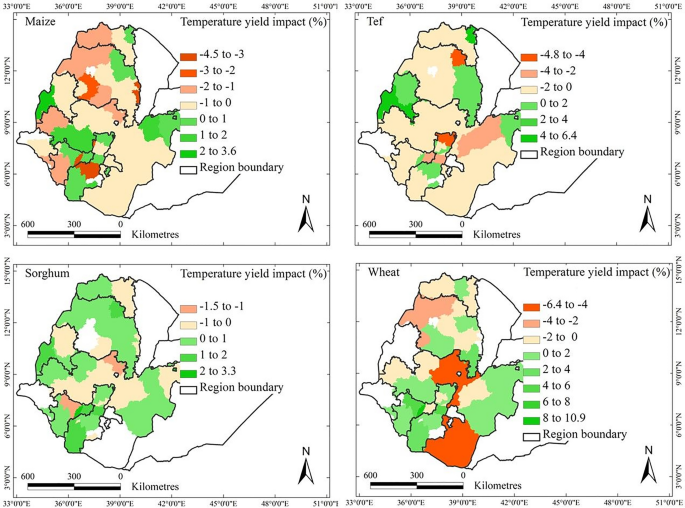
Patterns of the contribution of the trends in temperature at the level of administrative zone to the observed yields of maize, sorghum, tef, and wheat over 1995–2018 in the main crop-growing areas of Ethiopia. Percentages given are defined as crop yield trends due to trends in temperature divided by the overall trend in crop yield, all values taken per AZ over the period 1995–2018. White regions denote areas where a crop is not harvested or could not be examined.

Contribution of the trends in precipitation at the level of administrative zone to the observed yield trends of maize, sorghum, tef, and wheat over 1995–2018 in the main crop-growing areas of Ethiopia. Percentages given are defined as crop yield trends due to trends in precipitation divided by the overall trend in crop yield, all values taken per AZ over the period 1995–2018. White zones denote areas where the crops of interest are not grown or where no data were available.
On average across the whole country, temperature-induced gains in yield in the AZs that were positively affected by 0.73, 0.81, 1.09, and 2.43% per year for maize, sorghum, tef, and wheat, respectively. Conversely, the temperature-induced losses in yield for these crops were 1.16, 0.33, 1.21, and 2.04% per year, respectively. Temperature-induced net impacts across the country were ‒0.43, 0.39, ‒0.11, and 0.30% per year for maize, sorghum, tef, and wheat, respectively.
Spatially, the trends in temperature had both negative and positive effects on crop yields, with the impacts differing by crop type and region. Maize yields were mostly negatively affected by temperature trends in the north-central and southern regions of the country, but in some areas the impacts were positive. In contrast, sorghum yield increased substantially across most regions, with yields increasing by up to 3.3% of the AZ average over the 24-year period. Tef yield was mainly negatively affected in the Tigray, Waghemra, West Gojjam, Gurage, and West Harerge AZs. Similarly, wheat yield was negatively affected in West Gojjam, Awi, East Shewa, and Borena.
The trends in precipitation predominantly had negative impacts in most AZs for maize and wheat crops. The precipitation-induced gains in yield between 1995 and 2018 were 1.3, 0.4, 0.6, and 0.7%, and the precipitation-induced losses in yield were 3.4, 0.4, 0.6, and 1.1%, for maize, sorghum, tef, and wheat, respectively. The net impacts for the country were generally more positive, with a decrease in yield of 2.1 and 0.4% for maize and wheat and increases of 0.04 and 0.02% for sorghum and tef, respectively.
Maize yields were affected by trends in precipitation most, with decreases up to 27% in the South Tigray, Waghemra, North Wollo, and North Shewa. The effect of trends in precipitation on Sorghum yield varied, with negative impacts in South Tigray, Gonder, Arsi, and Hadiya but positive impacts in most other regions. Tef yield was negatively affected by precipitation trends mainly in the central and southern parts of the country but positively affected in other AZs. Similarly, wheat yield was primarily negatively affected by precipitation trends in the western and southern administrative zones.
The yield of all crops benefitted from the trends in solar radiation in most parts of the country, but the impact was small (Fig. 8). The trends in solar radiation positively affected yields on average by 0.88, 0.37, 0.53, and 0.97% per year for maize, sorghum, tef, and wheat, respectively, over the entire period 1995–2018. The negative impacts (up to ‒14.4% per year) on maize yields happened mainly in Eastern Tigray, Wollo, Waghemra, Asosa, and North Shewa AZs, but all other areas were positively affected. Sorghum yield, however, decreased by up to 0.8% per year in the Harari, Arsi, East Harerge, Sheka, and South Omo AZs. Tef yield was negatively affected (up to ‒3% per year) in West Gojjam, Asosa, Metekel, North Shewa, South Wollo, Central Tigray, and Borena. Wheat yield was negatively affected (up to ‒4.3% per year) in the Awi, Gondar, West Gojjam, Eastern Tigray, North Shewa, East Shewa, and Borena AZs.
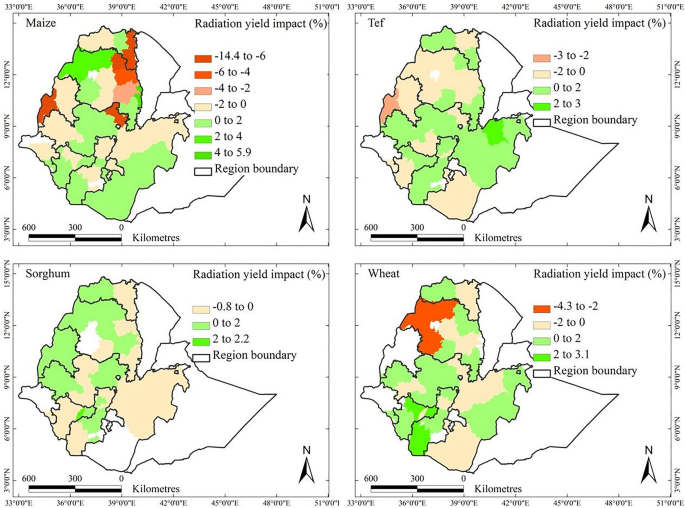
Contribution of the trends in solar radiation at the level of administrative zone to the observed yield changes of maize, sorghum, tef, and wheat over 1995–2018 in the main crop-growing areas of Ethiopia. Percentages given are defined as crop yield trends due to trends in solar radiation divided by the overall trend in crop yield, all values taken per AZ over the period 1995–2018. White zones denote areas where the crops of interest are not grown or where no data were available.
Dominant climatic drivers of yield trends
To identify the dominant climatic driver for each crop and region, we assessed which of the three variables, temperature, precipitation, or radiation, contributed most to the observed yield trends (Fig. 9). Temperature was the dominant climatic factor in 28.5% of the maize-growing areas, which accounted for 46.8% of the national maize production, particularly located in the western and southeastern regions. Sorghum yield trends were influenced by temperature in 25.6% of the growing areas, contributing to 19.4% of the national sorghum production. For tef, temperature was the dominant factor in 34.3% of the tef-growing areas, particularly in the northern and southern areas. Temperature was the dominant climate factor for wheat yield trends in some central parts of the country, covering 27.7% of the total (national) wheat-growing area.
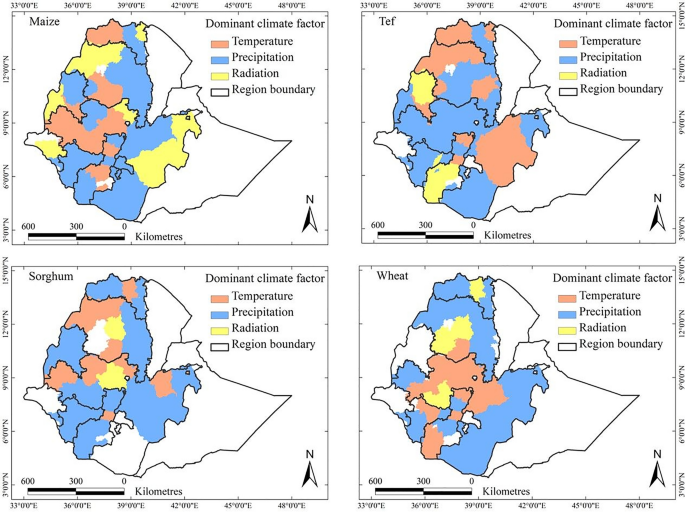
Individual climatic factors dominating the climate-driven trends in maize, sorghum, tef, and wheat yields, respectively, between 1995 and 2018 in Ethiopia. White zones denote areas where the crops of interest are not grown or where no data were available.
Precipitation was a significant climatic factor influencing the trends in crop yields across various regions. For maize, precipitation was the dominant factor in 42.1% of the maize-growing AZs, contributing about 35.9% to the national maize production. Sorghum yield in the majority of the crop-growing areas was primarily influenced by precipitation, which was the dominant factor in 68.2% of the growing areas, equivalent to 76.1% of national sorghum production. Similarly, precipitation was the dominant factor for tef yield in 56.3% of the tef-growing areas, making it the dominant driver for most of the crop-growing areas. For wheat, precipitation was the dominant factor affecting yield trends in most parts of the country, accounting for 67% of the total wheat-growing AZs.
Solar radiation also influenced crop yield trends but was less than temperature and precipitation. For maize, radiation was the dominant factor in 29.4% of the maize-growing areas, contributing 17.4% to the national production. Sorghum yield trends were influenced by radiation in a few areas, although its role was less pronounced that of as precipitation and temperature. For tef, solar radiation was the primary factor in 9.4% of the production areas. Wheat yield trends were dominantly controlled by solar radiation in Central Tigray, South Gonder, West Gojjam, Awi, and Jimma, covering 10.3% of the total wheat-growing areas. The substantial spatial variation in the dominant climatic factors clearly demonstrated that the impacts of climate were local or regional and should be addressed by considering local environmental settings.
Climate’s contribution to overall yield trends
We further assessed the overall contribution of climatic trends by comparing climate-induced yield changes with total observed yield trends. This approach isolates the climatic signal from other influences such as technology advancements. Figure 10 illustrates the overall impact of all climatic factors (temperature, precipitation, solar radiation) on the total trend in yield for 1995‒2018. The climate impact varies from − 39.2% (maize, Waghemra AZ) to 12.5% (wheat, Segen people AZ). Specifically, the contribution of climatic trends to the trends in maize yield varied from − 39.2 to + 3.4% in main production areas such as Shewa, Gojjam, Wollo, South Tigray, and East Welega. However, the average effect on crop yields was small, because gains in some regions offset losses in others.
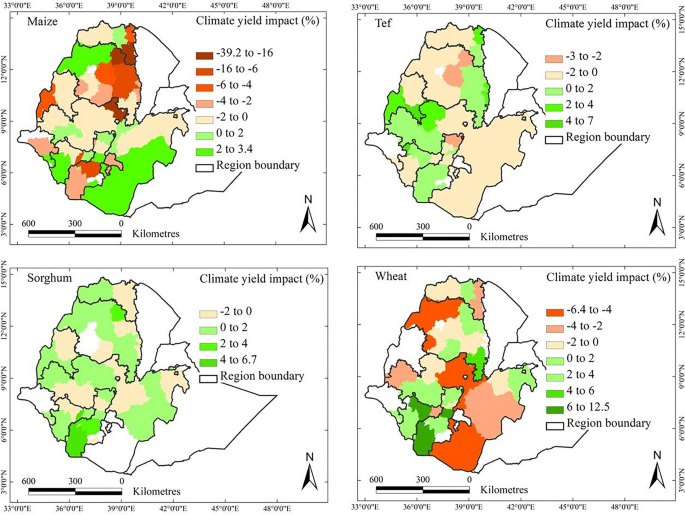
Contribution of all climatic factors to the trends in maize, sorghum, tef, and wheat yields in the main crop-growing regions of Ethiopia. Percentages given are defined as crop yield trends due to trends in climatic factors divided by the overall trend in crop yield, all values taken per AZ over the period 1995–2018. White zones denote areas where the crops of interest are not grown or where no data were available.
On average at the country level, the climatic trends contributed to ‒3.2% for maize, 0.6% for sorghum, 0.2% for tef, and 0.7% for wheat, indicating that other factors were driving the changes in crop yield (see also Supplementary Fig. 7). The impacts were positive in most regions of the country, despite the average net decrease of 3.2% per year for maize. These findings also highlight that the effects of climatic trends on crop yields are complex and vary with location and crop type.
We also evaluated the effects of climatic trends derived from selected productive districts’ mixed-effects models in comparison with those obtained from the corresponding AZ mixed-effects models. Our analysis found a substantial similarity in the outcomes across these spatial levels (see Supplementary Fig. 8), indicating consistency in the climatic signal captured at both district and zonal scales.
Comparison of outputs from linear mixed-effects and first-difference regression models
To assess the robustness and consistency of climate-yield relationships across different temporal and statistical frameworks, we compared the estimated impacts of climate variables on crop yields derived from the linear mixed-effects model (LMM) and the first-difference regression model (FDRM) (see Supplementary Fig. 9). The LMM quantifies the long-term contributions of both climatic and non-climatic factors to crop yield trends, incorporating spatial heterogeneity through random effects at the AZ level. In contrast, the FDRM isolates short-term, interannual yield responses to year-to-year climate variability by removing temporal trends and focusing on within-AZ annual fluctuations.
The average overall climatic impact estimates obtained using the first-difference regression model were ‒ 0.59% per year for maize, 0.53% per year for sorghum, 0.26% per year for tef, and 0.68% per year for wheat over 1995‒2018. When compared to the LMM outputs, the strength of the association between the climatic impact estimates from the two models varied across crops, as indicated by the CD values, 0.61 for maize, 0.46 for sorghum, 0.52 for tef, and 0.63 for wheat. These values suggest a moderate to strong correlation between the LMM and FDRM models, with wheat and maize exhibiting the highest agreement, while sorghum displayed the weakest association.
Notably, sorghum exhibited the lowest CD value (0.46), particularly in North Shewa and Oromia Special AZs, where the first-difference model estimated positive yield impacts, whereas the mixed-effects model indicated negative effects. This discrepancy highlights potential regional variations in climate responsiveness or the influence of additional factors not captured equally by both models. Similarly, in East Tigray and Konta Special AZs, both models estimated negative impacts of climate trends on yield, but the magnitude of these effects differed.
Overall, while both models produced qualitatively similar results, they differed in the magnitude and, in some cases, the direction of estimated impacts in specific regions. These differences may be attributed to a combination of limited sample sizes and inherent structural differences between the models. The linear mixed-effects model accounts for hierarchical structures through random effects, whereas the first-difference regression model removes time-invariant effects but does not effectively handle group-level heterogeneity. By comparing them, we increase confidence in robust signals (e.g., precipitation effects on sorghum and wheat) and identify areas where model assumptions affect interpretation.
Contribution of non-climatic factors to crops yield variability
To disentangle the influence of non-climatic factors, particularly technological advancements, from climate-induced yield trends and variability, we incorporated a temporal trend (year) in the mixed-effects regression model. This variable served as a proxy for gradual, systematic improvements unrelated to climate, such as improvements in agronomic practices, increased input use, improved irrigation systems, and the development of high yielding cultivars.
The fixed effect of the year variable was positive and highly significant (p 3), indicating a consistent upward trend in yields due to non-climatic influences for 1995–2018 period. Maize and tef both show an estimated year coefficient of 0.046, implying an average increase of 4.6% per year in yield, independent of climatic variables. Sorghum shows the highest year effect (0.051), pointing to relatively greater benefits from non-climatic advancements in sorghum-growing AZs. Wheat follows closely with a year coefficient of 0.043, reflecting significant technological progress in wheat growing areas.
These temporal trends are further visualized in the partial dependence plots for time (Fig. 11). Figure 11A illustrates a clear upward trend in the average annual yields of maize, sorghum, wheat, and tef across the AZs for the study period. Notably, maize exhibits the highest yield gains over time, followed by wheat and sorghum, while tef shows relatively modest improvement. These trends are further substantiated by the partial dependence plots in Fig. 11B, which isolate the marginal effect of time on crop yield after accounting for other covariates in the model. The consistent positive slope in these plots for all crops indicates a strong temporal component contributing to yield gains, interpreted here as a proxy for non-climatic factors, primarily technological advancements. Our estimates indicate that in the period 1995–2018 the temporal advancements contributed to country level yield increase of approximately 96.8 kg/ha per year for maize, 71.1 kg/ha per year for sorghum, 70.5 kg/ha per year for tef, and 44.9 kg/ha per year for wheat.
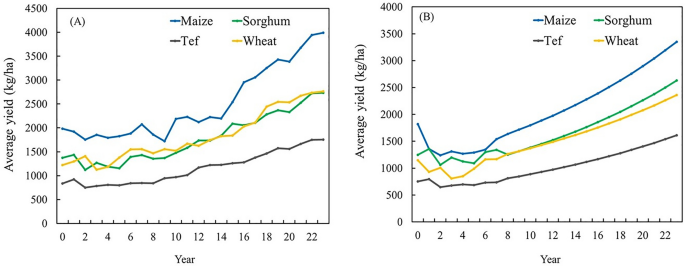
Average annual yield for maize, sorghum, tef, and wheat across all administrative zones for the period 1995–2018 (A). Partial dependence plot for time (B). Maize, sorghum, tef, and wheat are denoted by blue, green, black, and orange lines, respectively. Partial dependence plots graph the independent variable against the model outcome, after accounting for the average effect of other independent variables in the model.
Random effects associated with the year variable indicate substantial variability in yield trends across AZs (Table 3). For instance, the standard deviation of the random intercept for year in tef (0.012) is notably smaller than for sorghum and wheat (both 0.017), suggesting more homogeneous yield trends in tef compared to other crops. The high residual variances for sorghum and wheat (0.442 and 0.434, respectively) reflect substantial unexplained heterogeneity.