Hi all,
I don’t know what’s wrong with me but today I decided go pull all my Stater Brothers receipts since March of 2024.
I tracked every purchase: what the items were, when I bought them, and what I paid for it. I then categorized all items in to main categories and sub-categories.
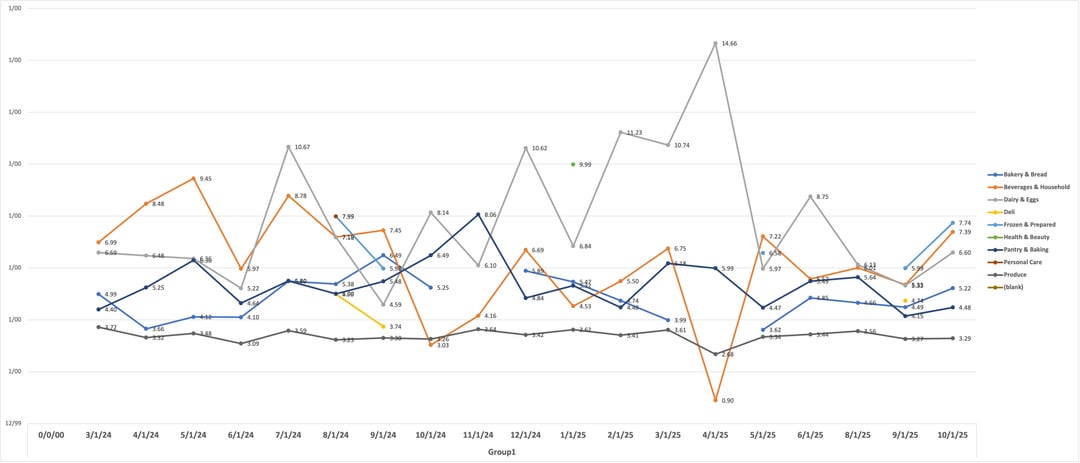
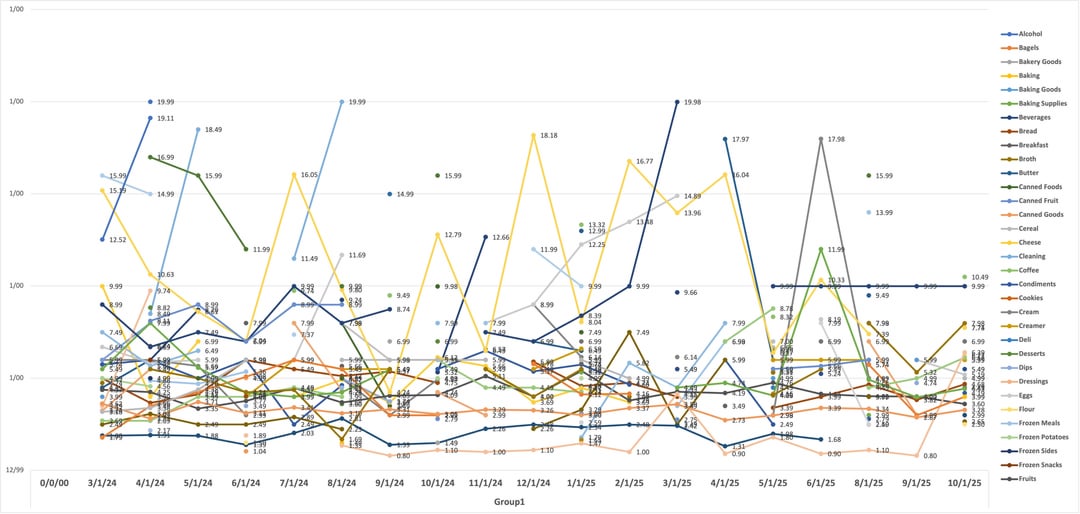
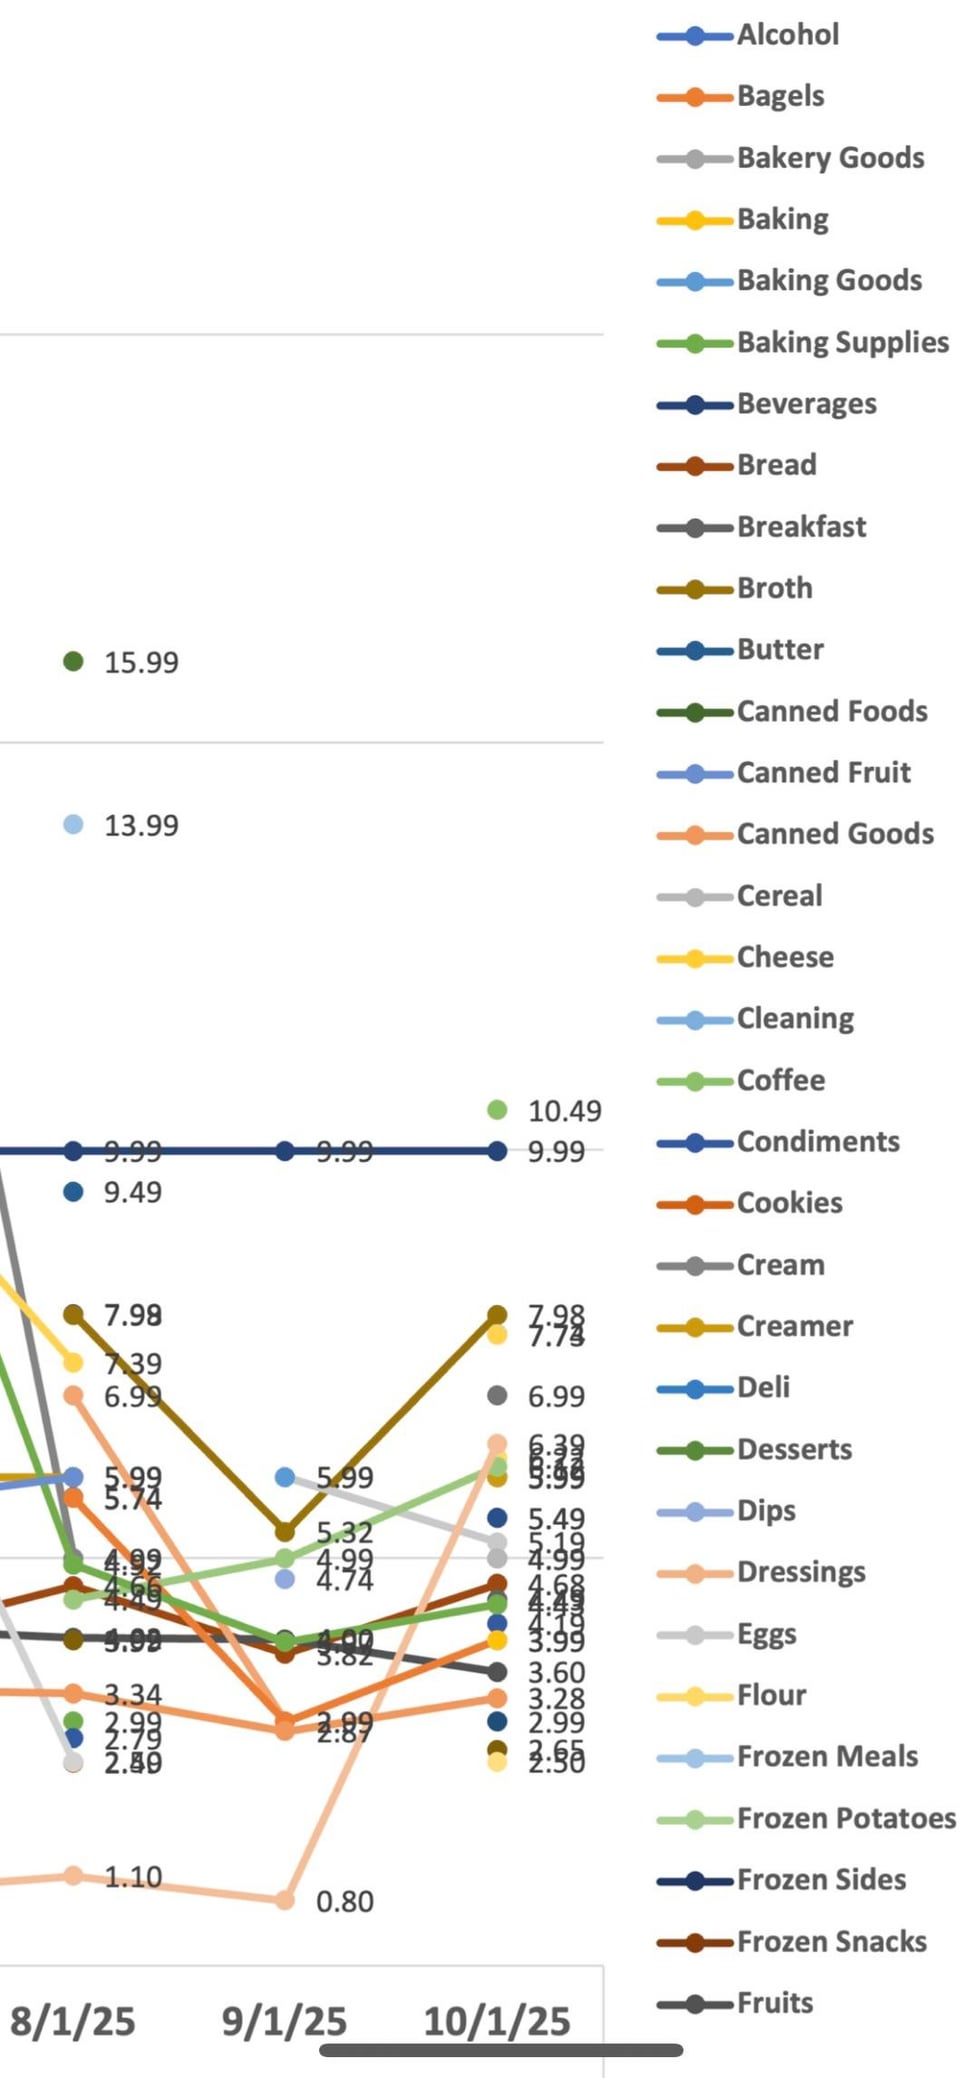
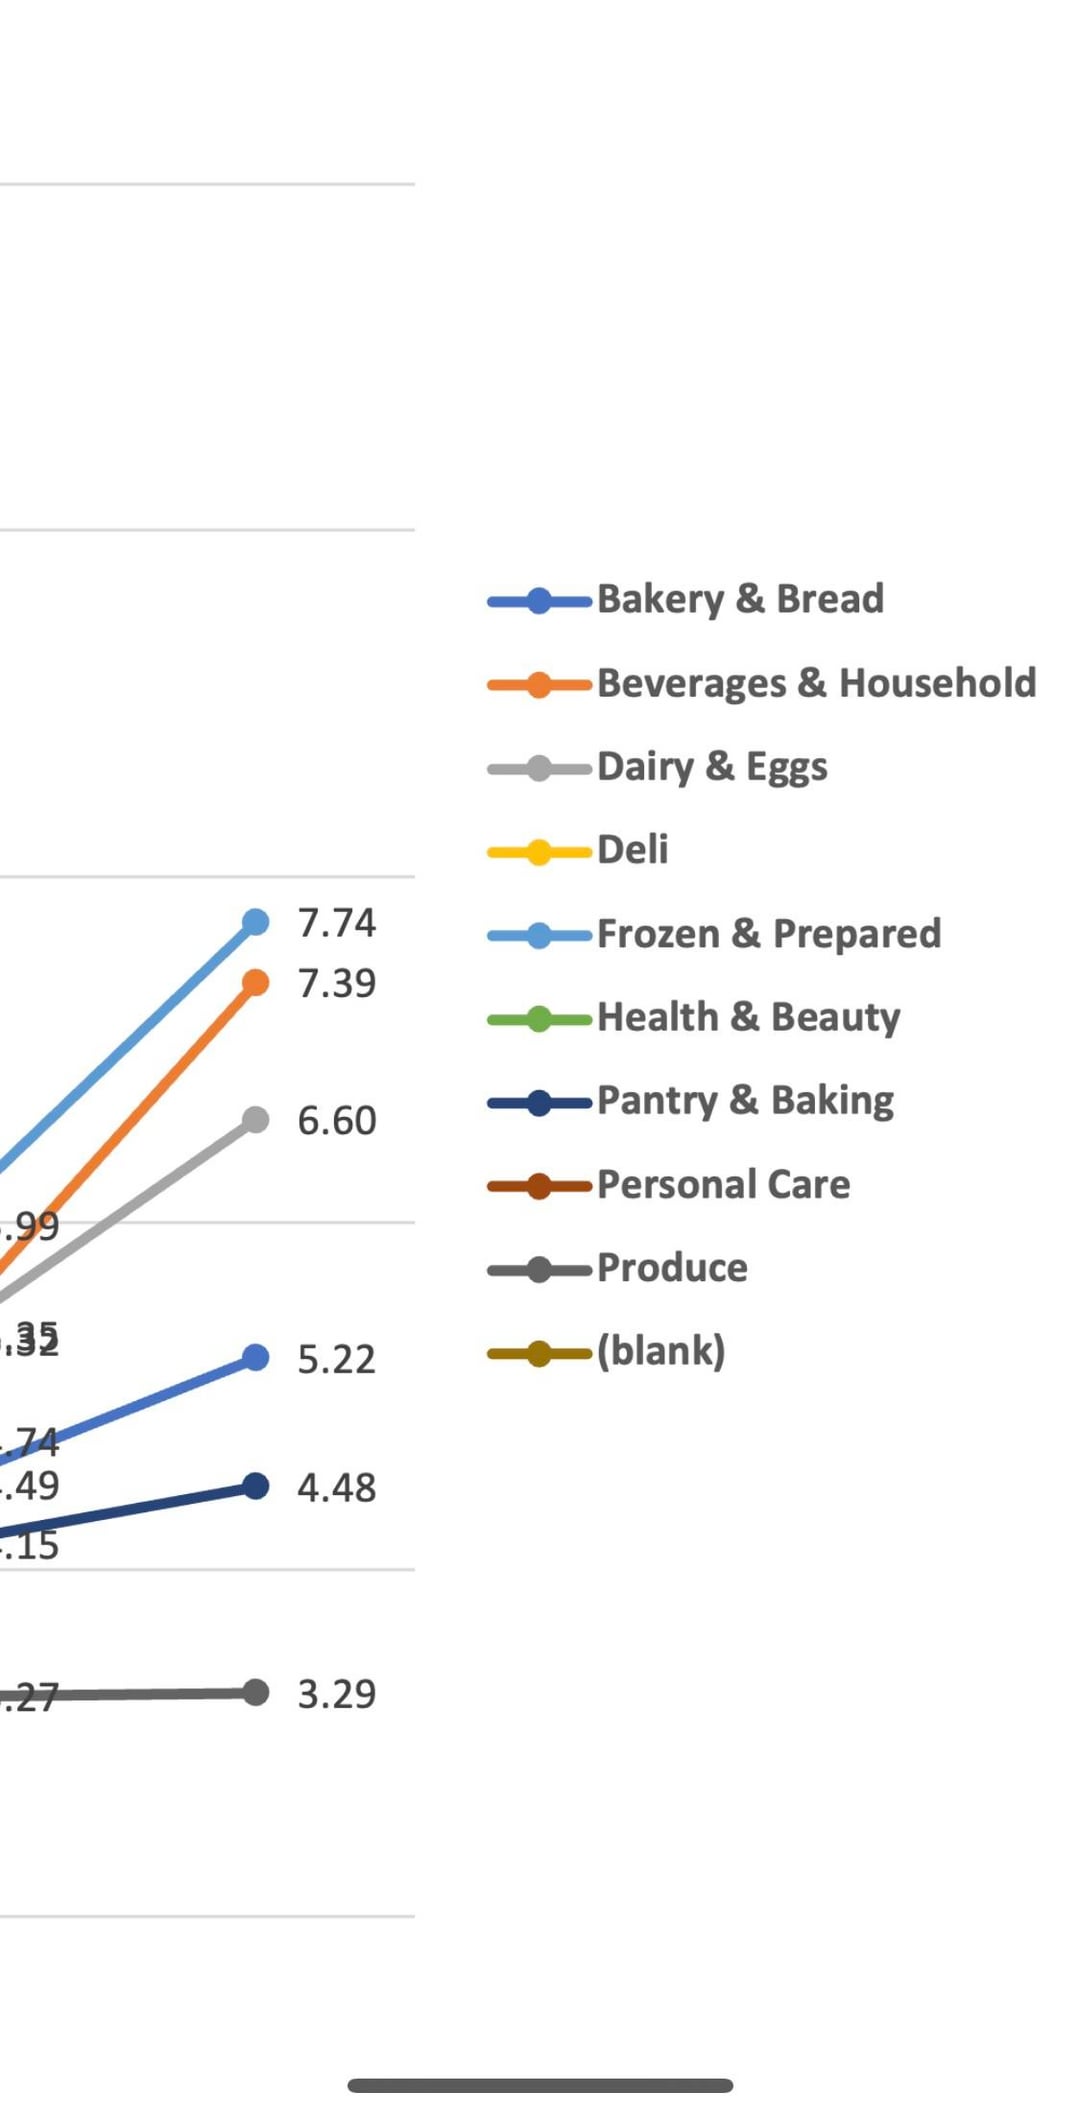
Here are the data charts for each category and subcategory. The X axis represents the month/year of purchase and the Y axis represents the average cost of items in that category.
Now I in no way have any idea what I’m doing with excel so this doesn’t look the best but I found the data interesting. I also in know way know anything about analyzing data, again just found the results interesting.
Notably, September 2025 was the only point in time where almost all categories increased all at the same time. Does anyone have any idea what would have driven this across the board increase on all goods all at once?
Let me know your thoughts!
Posted by JuneyGloomy
11 comments
Did you travel in September 2025?
So I’m gathering that everything went up, except the baking. I’m going to hazard a guess that current political situations have aided in this.
The effects of Trump’s insane economic policies are kicking in.
This is awesome. Do you have a table?
Am I missing something, or how is your “main categories” chart pricing so low? There’s no way you’re only spending like $35 in a month
Does it match federal data? I noticed my grocery deli meat went up 30% in the last month
How much selection bias do you think there is here? E.g. were there cases where you saw an item that was too expensive so you didn’t buy it?
So many data labels, you can’t read this clearly
I know this is just exploration but not sure if line graph is the best for this, personally it is too much information to track anything at all, may be a stacked bar chart
Did you track or account for shrinkflation where possible? Like if a bag of chips was $3.99 at 16oz, but then stayed at $3.99 but dropped to 14oz?
I think this would be easier to interpret if you converted to percent change from baseline cost. So every item would start at 0 on the y-axis and move from there.
Comments are closed.