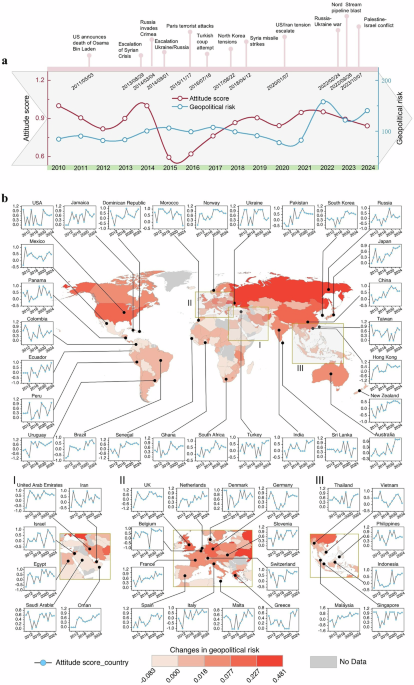
To examine the spatiotemporal evolution of the shipping decarbonization attitudes under varying geopolitical risks exposure, we utilized nation-level decarbonization attitude scores derived from NLP-based sentiment analysis of news text big data alongside the Geopolitical Risk Index developed by Caldara and Iacoviello13. The national decarbonization attitude score ranges from −1 to 1 and is proxied as the ratio of the total sentiment score of all text documents in that country for the year to the total sentiment score of all countries worldwide. It reflects the overall attitude of stakeholders or practitioners in the country’s shipping industry toward decarbonization goals, ranging from positive to negative or neutral, which affects the efficiency of their subsequent decarbonization actions. Figure 1a reveals a strong correlation between major geopolitical events and shifts in decarbonization attitudes. Before 2019, attitudes exhibited moderate fluctuations, reflecting a gradual alignment with climate goals. However, post-2019, geopolitical tensions increasingly overshadowed environmental priorities, underscoring the challenge of sustaining momentum amid crises. The 2022 Russia–Ukraine conflict marked a turning point, triggering a pronounced and sustained decline in attitude scores across many nations from an average of 0.707 to 0.556. Subsequent events, including the Nord Stream pipeline explosion and the Palestine–Israel conflict, further exacerbated negative trends.

a It reveals the time-series evolution of the shipping sector’s decarbonization attitude and geopolitical risk. The timeline above the graph highlights major global geopolitical events. Geopolitical risk (global) is represented by a dark blue line. The red line represents the global sentiment score, indicating the decarbonization attitudes of the shipping sector. A lower score indicates a less positive attitude towards decarbonization within the shipping sector. b Presents the changes in national decarbonization attitudes and geopolitical risk index. Subregions I–III present the assessed countries from selected parts of Europe, the Middle East, and South Asia. Specifically, Subregion I comprises the United Arab Emirates, Iran, Israel, Egypt, Saudi Arabia, and Oman; Subregion II comprises the United Kingdom, the Netherlands, Denmark, Germany, Belgium, France, Spain, Italy, Malta, Slovenia, Switzerland, and Greece; and Subregion III comprises Thailand, Vietnam, the Philippines, Indonesia, Singapore, and Malaysia. Blue dots represent each country’s attitude score for the respective year. Map colors correspond to changes in each country’s geopolitical risk. The changes in the geopolitical index at the national level from 2010 to 2023 can be examined in Supplementary Fig. 11. We use 2021 as a pivotal year for the calculations, averaging the three years before and after this point. The mutation year is detected using Mann-Kendall trend examining (Supplementary Methods 4).
Figure 1b illustrates the geographical variations of geopolitical risk and annual decarbonization attitude across selected countries. The geopolitical risk index exhibits a general increase, with a more pronounced rise in the Global North compared to the Global South. Specifically, regions such as Europe, East Asia, and North America display increases in geopolitical risk, with countries like Russia, and the United States exhibiting particularly high levels of risk escalation. This disparity underscores differing geopolitical pressures between the Global North and Global South.
The line graphs for each country reveal the temporal dynamics of national decarbonization attitudes. Key observations indicate greater volatility and frequent changes in decarbonization attitudes until 2018, likely reflecting evolving policy responses and strategic adjustments as nations established frameworks for shipping sector decarbonization. However, the shipping industry’s attitude toward decarbonization has improved since 2018. This is mainly due to two factors: the greenhouse gas emission reduction strategy adopted by the International Maritime Organization (IMO) has catalyzed relevant international green shipping policies, and green shipping investment has undergone a structural transformation. Specific instances include: the launch of the global ship financing initiative known as the “Poseidon Principles” and the active response from financial institutions; the signing of the “Clyde Bank Declaration” by 22 countries to jointly build a “green shipping corridor”; and the rapid development of green shipping finance—the issuance of the industry’s first green bond by Japanese shipowner NYK Line is a clear testament to this. Nevertheless, a discernible deceleration in decarbonization momentum is observed post-2020. This slowdown is particularly evident in several Global North countries, such as European nations and Middle Eastern states, where heightened geopolitical risks appear to coincide with a diminished commitment to decarbonization. In Europe, for instance, countries like the United Kingdom, Germany, and France exhibit a decline in the growth rate of decarbonization attitudes after 2021. Similarly, Middle Eastern countries such as Saudi Arabia and the United Arab Emirates display a notable decline. Conversely, countries in Southeast Asia (such as Thailand, Singapore, and Indonesia) display more consistent and less volatile decarbonization attitudes, with comparatively subdued changes.
Detecting the impact of geopolitical risks on national decarbonization attitudes
We quantify the causal relationship between geopolitical risk and national decarbonization attitudes using a difference-in-differences analysis with staggered treatment (staggered DID) analysis (see “Methods”). Figure 2 presents the empirical regression results and parallel trends test results. Figure 2a reports the main estimates, incorporating nation-level control variables. The coefficient of Geo_risk×Intensity is negative and statistically significant at the 1% level. Specifically, the result indicates a decrease of 14.38 percentage points in decarbonization attitudes following the treatment.
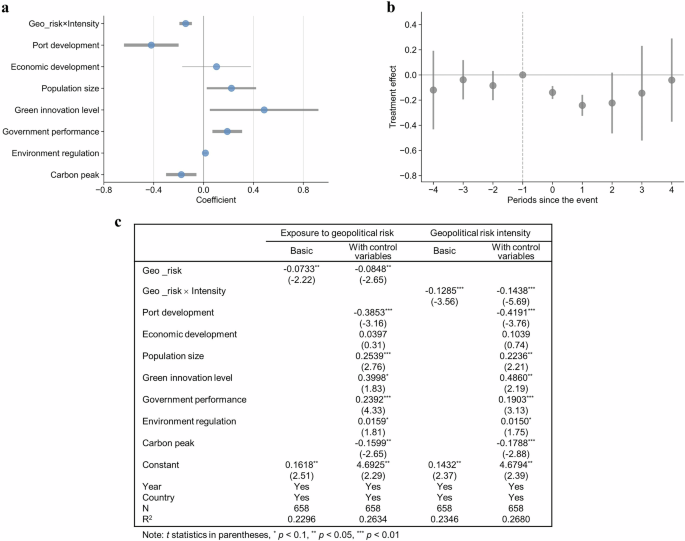
a Reports the benchmark regression results. The length of the line represents the 95% confidence interval. The dots indicate the median values, where the coefficient of the benchmark regression is taken. The thickness of the lines corresponds to significance levels of 1%, 5%, and 10%, respectively. b Presents the parallel trends test results (detailed in Supplementary Results 1). The length of the line represents the 95% confidence interval. The dots indicate the median values, from which the regression coefficients are derived. c Provides the detailed regression results, with all regressions controlled for country and time fixed effects.
Figure 2b provides support for parallel trends, the main causal assumption of DID designs, which requires that treatment and control groups follow similar outcome trends before the intervention, thereby allowing post-treatment divergence to be attributed to the causal effect. Prior to the occurrence of geopolitical risk (−1 Period), the coefficient estimates are insignificantly different from 0, indicating no significant difference between the treatment and control groups before the shocks. Following the onset of geopolitical risk, the decarbonization attitudes decrease significantly in the sample experiencing geopolitical risk, consistent with the benchmark regression results. Figure 2b further illustrates a persistent negative shift in decarbonization attitudes following major geopolitical disruption.
Figure 2c provides the detailed benchmark regression results, with all regressions controlled for country and time fixed effects. The estimates remain consistent across different controls, underscoring the detrimental effect of geopolitical risks on national decarbonization attitudes. Columns (1) to (2) show the effect of non-intensity geopolitical risk, measured as the average risk level for each country over the study period. Columns (3) to (4) examine the impact of intensity geopolitical risk, measured by multiplying the mean value by the corresponding annual geopolitical risk level. The coefficients of intensity geopolitical risk (columns 3 and 4) amplify both the significance and scale of the observed impacts, emphasizing the instantaneous impact of geopolitical risks on national decarbonization attitudes. Columns (2) and (4) include nation-level control variables to account for additional factors that may simultaneously affect a country’s decarbonization attitude. All coefficients are negative and statistically significant at the 5% level or better. Specially, the coefficients of Port development and Carbon peak are negative and significant at the 1% level, indicating that countries with higher port throughput and peak carbon dioxide emissions are more susceptible to geopolitical risks, causing them to waver their decarbonization stance. This finding provides empirical evidence for the Tragedy of the Commons in the current climate actions of the shipping sector.
Comprehensive robustness tests reinforce the reliability and validity of our findings (see Supplementary Results 2).
We also observe pronounced temporal volatility in national maritime decarbonization attitudes in Fig. 1b, which may reflect the sensitivity of sustainability commitments to evolving geopolitical dynamics. To further explore this relationship, we performed a staged regression analysis to examine how the causal relationship between geopolitical risk and national decarbonization attitudes evolves over time. We divided the time period into three distinct time spans: 2010–2013, 2014–2017, and 2018–2021. As shown in Fig. 3, geopolitical risks had no significant impact on national decarbonization attitudes in the first stage (Column 1). However, in the second and third stages (Columns 2 and 3), the coefficients of Geo_risk×Intensity are all negative and statistically significant at the 1% level, with geopolitical risks in the third stage exerting increasingly detrimental effects. This suggests that geopolitical risk has a significant impact on national decarbonization attitudes, and this impact deepened over time.
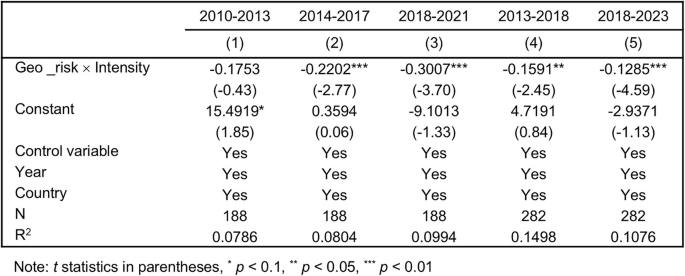
It presents the results of DID analysis examining the impact of geopolitical risk intensity on attitudes toward decarbonization during different time periods.
We conducted another two-stage regression analysis, excluding the initial period of 2010–2013. The remaining time period was divided into two equal spans: 2013–2018 and 2018–2023. The coefficients of Geo_risk×Intensity are consistently negative and statistically significant (Columns 4 and 5), indicating a causal relationship between geopolitical risk and diminishing national decarbonization attitudes. We observe a statistically significant relationship at the 1% level in the later stages, reflecting a stronger causal link between geopolitical risks and declining decarbonization attitudes over time. It suggests that heightened geopolitical risks substantially contribute to the deterioration of decarbonization attitudes. This can be attributed to the marked increase in geopolitical risks post-2021, driven by a higher frequency of global geopolitical events (see Fig. 1a). However, this effect diminishes in the second period, comparing −0.1591 and −0.1285. As discussed in reference to Fig. 1b, IMO has adopted a more comprehensive and frequent set of climate-responsive measures since 2018. This suggests that climate policies need to be continuously strengthened and monitored to effectively counteract external risks.
The heterogeneity in national decarbonization attitudes
Building on the benchmark and multi-period regression analyses, we proceed to examine how national decarbonization attitudes vary across countries when confronted with geopolitical risks, thereby providing a deeper understanding of heterogeneous responses. To examine these differences, we classified countries into two groups: the top 50% and the bottom 50%, which enables us to highlight the variations between nations with differing economic scales, military strengths, and cultural backgrounds in their responses to geopolitical challenges. Detailed indicator settings and regression results are provided in Supplementary Results 2.
Figure 4 illustrates the heterogeneity analysis of national decarbonization attitudes in response to geopolitical risks, highlighting how different countries are variably affected by national characteristic factors. The coefficients for almost all groups are significantly negative, revealing that increased geopolitical risk correlates with a decline in decarbonization willingness. However, the degree of this effect varies significantly across nations.
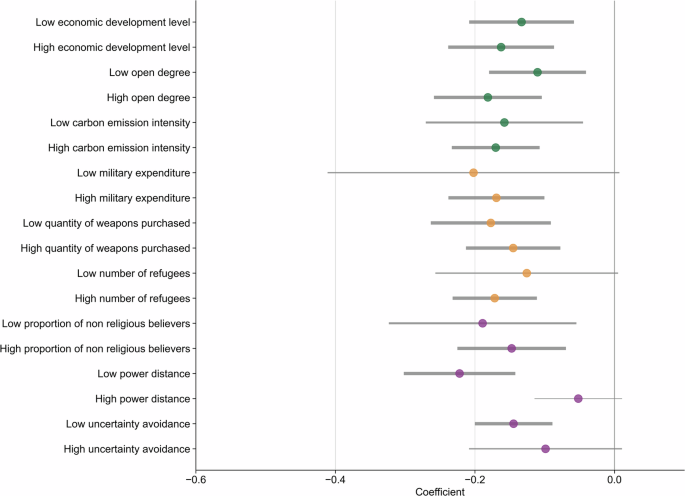
The green dots represent macroeconomic and institutional factors, the orange dots represent military and social stability, and the purple dots represent religious and cultural factors. The length of the line represents the 95% confidence interval. The dots indicate the median values, from which the regression coefficients are derived. The thickness of the lines corresponds to significance levels of 1%, 5%, and 10%, respectively. The detailed regression results can be found in Supplementary Results 3.
First, we examined the level of economic development, degree of openness, and carbon emission intensity to analyze the heterogeneity of national decarbonization attitudes influenced by national macroeconomic and institutional factors. The coefficients for all groups are significantly negative, with the high groups being significant at the 1% level and lower than those of the low groups. This indicates that countries with higher levels of economic development, greater openness, and higher carbon emission intensity are more likely to scale back their decarbonization ambitions in response to geopolitical risks. This trend underscores the complex relationship between economic structures, energy intensity, and climate policy willingness, especially in the context of global geopolitical volatility.
Second, we explored the heterogeneity of national decarbonization attitudes influenced by national military capabilities and social stability by examining three indicators: military expenditure (MEP), quantity of weapons purchased (QWP), and the origin of refugees (ROI). The coefficients for all groups are significantly negative. Notably, the coefficients for Low_MEP and Low_QWP show greater reductions, with average decreases of ~20.21% and 17.73%, respectively. The coefficient of High_ROI is lower than that Low_ROI, with an average decrease of ~17.17%. This indicates that countries with certain military and social stability characteristics are less prone to reduce their decarbonization ambitions in response to geopolitical risks. It suggests that countries facing greater social and political pressures prioritize maintaining social stability, potentially limiting the impact of geopolitical risks on their decarbonization commitments.
Finally, we investigated the impact of religious and cultural factors, including religious populations (RPO), power distance (PDI), and uncertainty avoidance (UAI). The findings highlight the importance of religious and cultural factors in shaping national responses to geopolitical crises, revealing that such factors can influence policy decisions in diverse and complex ways. The coefficients for RPO groups are all significantly negative, with a decrease of 18.91% for Low_RPO compared to a 14.74% decrease for High_RPO. The coefficients of Low_PDI and Low_UAI are negative and significant at the 1% level, while no significant causal effects were found in the high groups. The results indicate that cultures with more evenly distributed power and higher risk tolerance may be more adaptable in adjusting their decarbonization policies in response to external geopolitical factors. In contrast, no significant causal effects were found in the high groups of PDI and UAI, suggesting that countries with higher PDI (more hierarchical societies) and higher UAI (greater resistance to change) may be less responsive to geopolitical risks when altering their decarbonization objectives.
Verifying the association between carbon emissions and geopolitical risks
Building on our earlier findings on the evolving attitudes toward shipping decarbonization and the disruptive role of geopolitical risks, we provide empirical evidence linking these risks to actual shifts in global shipping emissions. Drawing from a comprehensive dataset of over 100,000 vessels, we quantified the impact of geopolitical crises on maritime CO₂ emissions and carbon intensity (DIST). This analysis demonstrates how geopolitical instability reshapes shipping CO2 emission patterns (see “Methods”).
Figure 5 highlights that geopolitical risks have led to an overall increase in carbon emissions, reinforcing the observed decline in decarbonization ambition. While regional conflicts, such as the Russia–Ukraine conflict (Fig. 5a) and the Nord Stream pipeline explosion (Fig. 5b), resulted in moderate emission increases, disruptions within major shipping corridors induced far greater surges in both total CO₂ emissions and carbon intensity across vessel types worldwide (Fig. 5c, Supplementary Figs. 12–17). This pattern reinforces our earlier findings that nations with high trade dependence tend to deprioritize decarbonization efforts amid geopolitical uncertainty. This is evidenced by increased emissions along key shipping corridors and a heightened reliance on carbon-intensive trade routes following geopolitical disruptions.
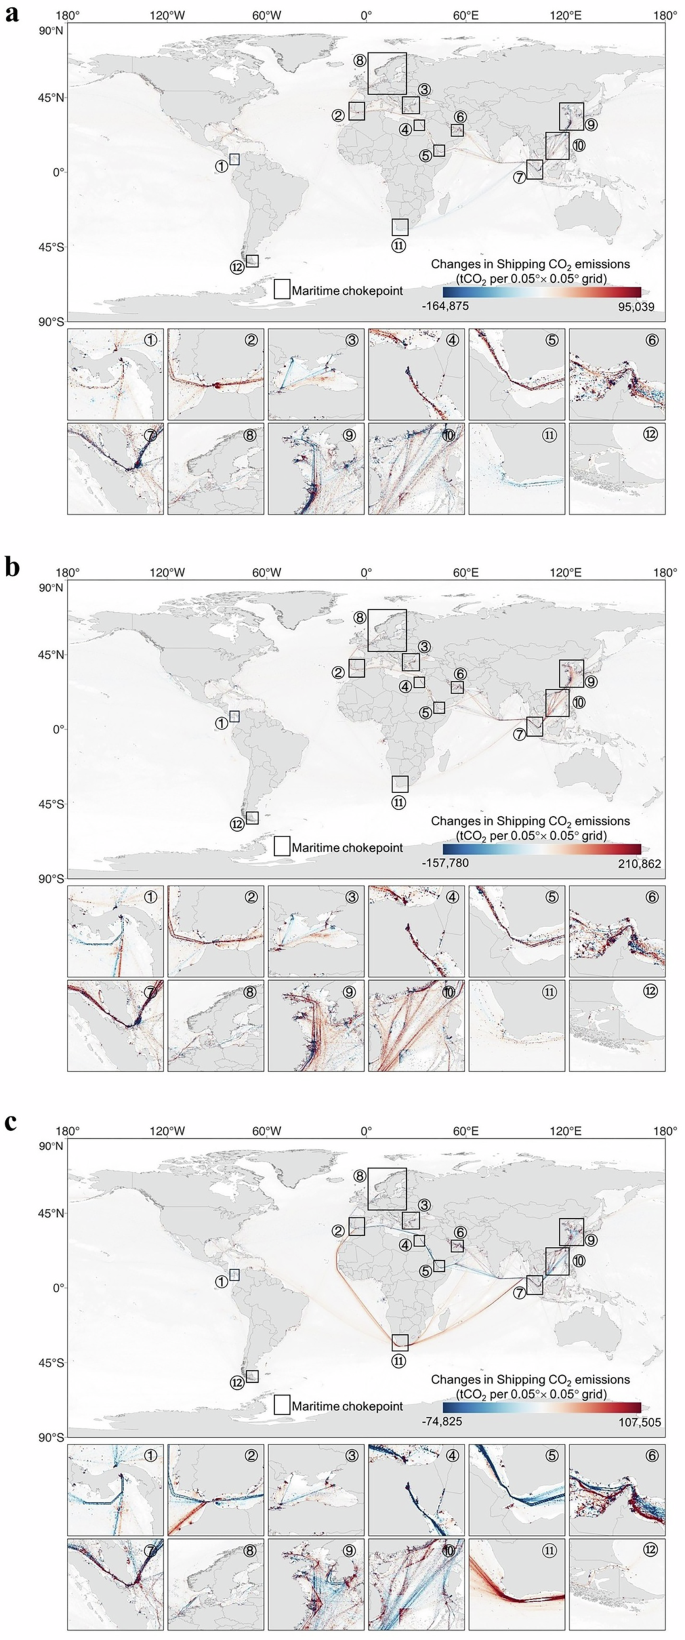
a–c Represents the spatial changes in the six months before and after three major geopolitical events. a Russia–Ukraine conflict. b Nord Stream pipeline blast. c Palestine–Israel conflict. The enclosed numeric represents thirteen major maritime chokepoints. Subplot magnify the spatial coverage of each maritime chokepoints to display their shipping CO2 emissions explicitly. The thirteen maritime chokepoints are 1-Panama Canal, 2-Strait of Gibraltar, 3-Turkish Straits, 4-Suez Canal, 5-Strait of Bal-el-Mandeb, 6-Strait of Hormuz, 7-Strait of Malacca, 8-Danish Straits, 9-East China Sea, 10-South China Sea, 11-Cape of Good Hope, 12-Cape Horn.
Specifically, the escalation of the Russia-Ukraine conflict, compounded by the Nord Stream pipeline blast, triggered a 1.5% increase in global shipping CO2 emissions (Fig. 5a, b). This pattern was reflected across most major shipping chokepoints, where emissions rose by 1.4% to 15.3%, with energy transport vessels being particularly affected (detailed in Supplementary Figs. 12–17). The outbreak of the Palestine–Israel conflict led to a substantial increase in carbon emissions from vessels compelled to navigate alternative routes around the Cape of Good Hope on Pacific and Indian Ocean routes (Fig. 5c). Carbon emissions from vessels transiting the Cape of Good Hope (chokepoint 12 in Fig. 5c) increased by 61.3% over a six-month period. Notably, shipping emissions between October 2023 and April 2024 rose by 1.36 million tonnes compared to the same period in the previous year.
Concurrently, the carbon intensity indicators DIST and TIME experienced increases of 9.40% and 35.96%, respectively, reaching 28.71 tonnes CO₂ per nautical mile and 0.51 tonnes CO₂ per hour. Simultaneously, ship carbon emissions exhibit a distinct north-south divergence. Carbon emissions from vessels originating in Europe declined, whereas emissions from vessels from West Africa saw a increase. These findings reinforce our earlier analysis, which highlighted the heterogeneous nature of national decarbonization responses to geopolitical risks. While some nations intensified their reliance on carbon-intensive trade routes, evidenced by rising emissions along major shipping corridors and increased energy transport disruptions.