I’m not usually in the debunking business, but today I make an exception. There’s a chart going around that suggests central banks are behind the recent spike in gold prices. Here’s the thing about that chart: it’s bogus. I show why in today’s post and illustrate how to look at central bank gold holdings – and purchases – properly. Once you do that, it’s clear central banks haven’t driven the crazy rise in gold prices. The precious metals bubble of recent months is all about retail buying, like every other bubble before it.

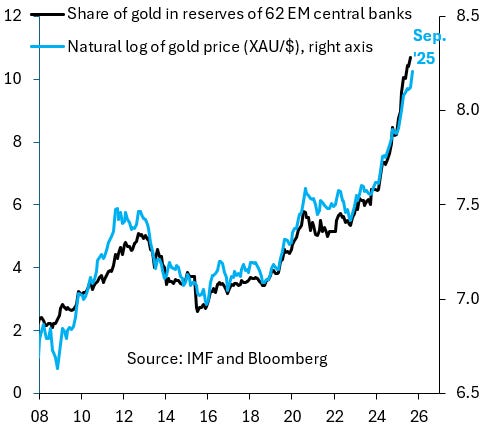
The chart above keeps getting used to claim central banks are behind the crazy rise in gold prices. On the left axis, it shows the share of gold holdings (black line) in total reserve assets across 62 emerging market (EM) central banks. Reserve assets consist mainly of holdings of the Dollar, other hard currencies and gold. On the right axis, it shows the natural log of the XAU/$ gold price from Bloomberg (blue line).
Now think about these two series. Typically, EM central banks hold most of their reserves in Dollars and the value of a Dollar is fixed at one. So the only way Dollar holdings can rise is if central banks buy more Dollars and we know that EM reserve accumulation has been modest in recent years. In contrast, the rise in the price of gold means that its share relative to the rest of central bank reserves is up massively. This would be true even if gold volumes held by central banks were stable over time. So all this chart is really doing is plotting the rise in gold prices twice. Once via the impact on its share in central bank reserves and once in terms of the actual gold price. This chart therefore correlates two series that are basically the same and says absolutely nothing about whether central banks are actually buying gold.
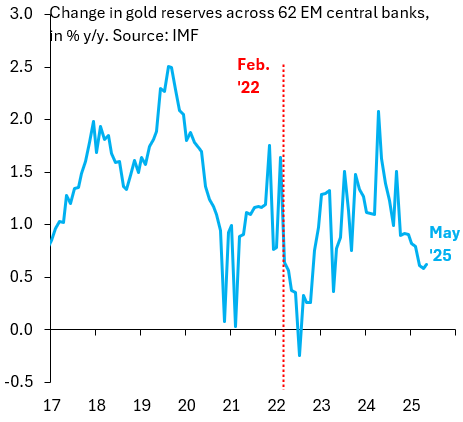
To assess whether central banks are actually buying gold and in what quantity, you have to look at volumes. The chart above shows the year-over-year changes in gold holdings for the same 62 EM central banks based on IMF data on volumes. There’s very little to suggest that central banks have been on a buying spree, not even after Russia’s invasion of Ukraine, which in many narratives gets cast as a catalyst for some central banks to have diversified out of the Dollar.
On average, it looks like EM central banks grow their gold holdings by about one percent per year, with some fluctuation around that number, which looks random. This fits the reality of central bank reserve managers, who invest conservatively and don’t spend their day punting on a gold rally. The central bank narrative as a driver of gold prices is bogus.