
Find out why Occidental Petroleum’s -17.1% return over the last year is lagging behind its peers.
Approach 1: Occidental Petroleum Discounted Cash Flow (DCF) Analysis
The Discounted Cash Flow (DCF) model estimates a company’s intrinsic value by projecting its future cash flows and discounting them back to today’s value using a required rate of return. This approach aims to reflect what the business is really worth based on its expected ability to generate cash in the years ahead.
For Occidental Petroleum, the model begins with the current Free Cash Flow of $5.6 billion. Analysts provide annual projections for the next five years. After that, Simply Wall St extrapolates the numbers based on expected trends. By 2029, Occidental’s Free Cash Flow is forecasted to reach roughly $4.4 billion, with further modeled growth across the following decade. These projections use both analyst input and trend-based estimates to map out the company’s future financial health.
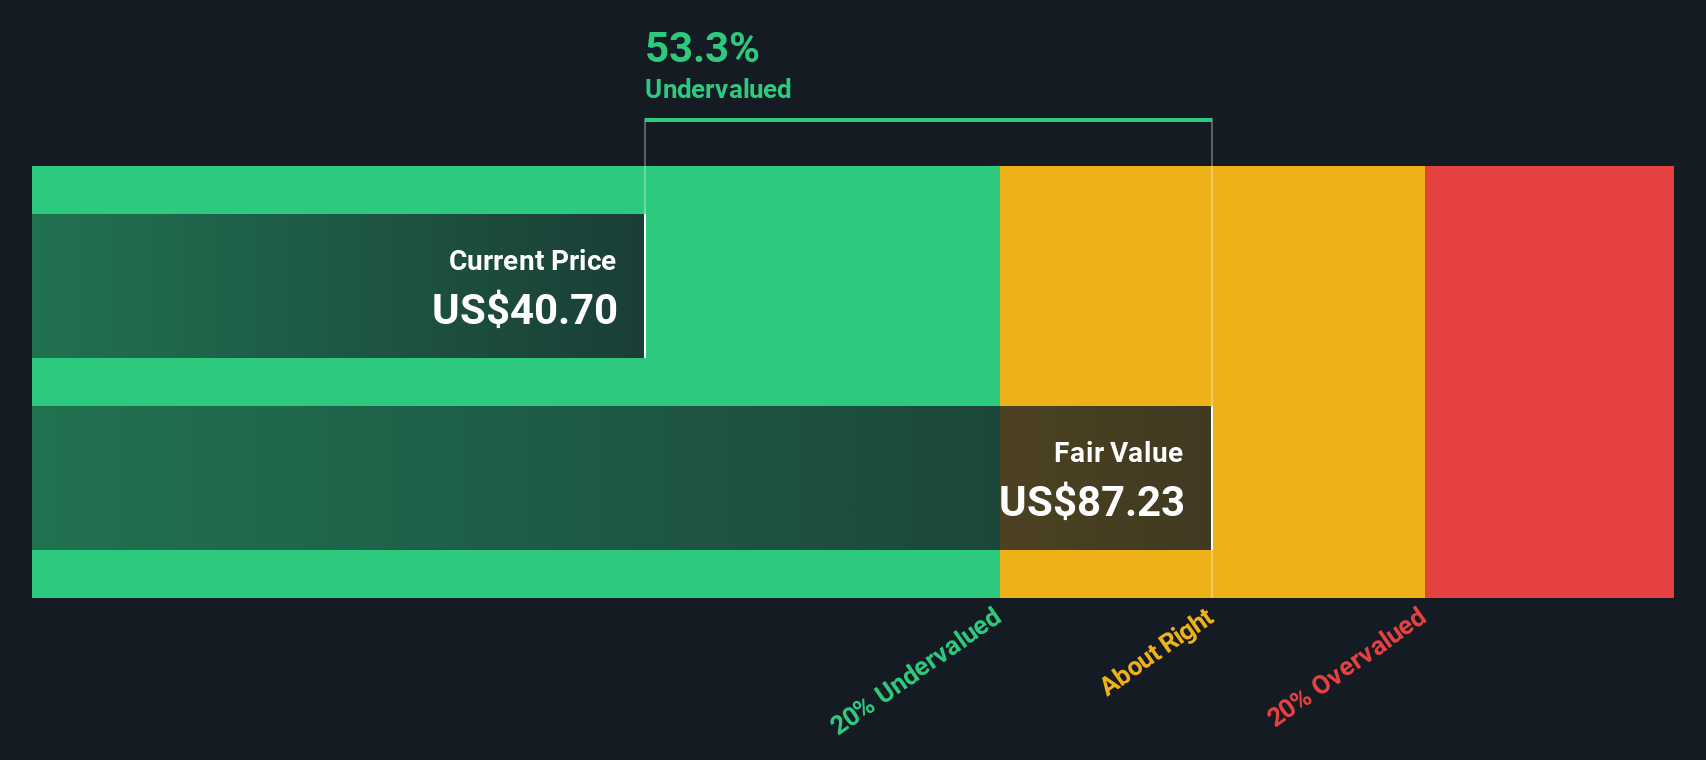
After discounting these future cash flows back to present value, the DCF model calculates an estimated intrinsic value of $87.23 per share. When compared to Occidental’s current share price, this suggests the stock is trading at a 53.3% discount to fair value.
Result: UNDERVALUED
Our Discounted Cash Flow (DCF) analysis suggests Occidental Petroleum is undervalued by 53.3%. Track this in your watchlist or portfolio, or discover 848 more undervalued stocks based on cash flows.
 OXY Discounted Cash Flow as at Oct 2025
Approach 2: Occidental Petroleum Price vs Earnings
For profitable companies like Occidental Petroleum, the Price-to-Earnings (PE) ratio is a widely used valuation tool because it directly compares how much investors are paying for each dollar of earnings. The PE ratio is especially helpful since it reflects both how the market views the company’s current profitability and its future potential to grow those earnings further.
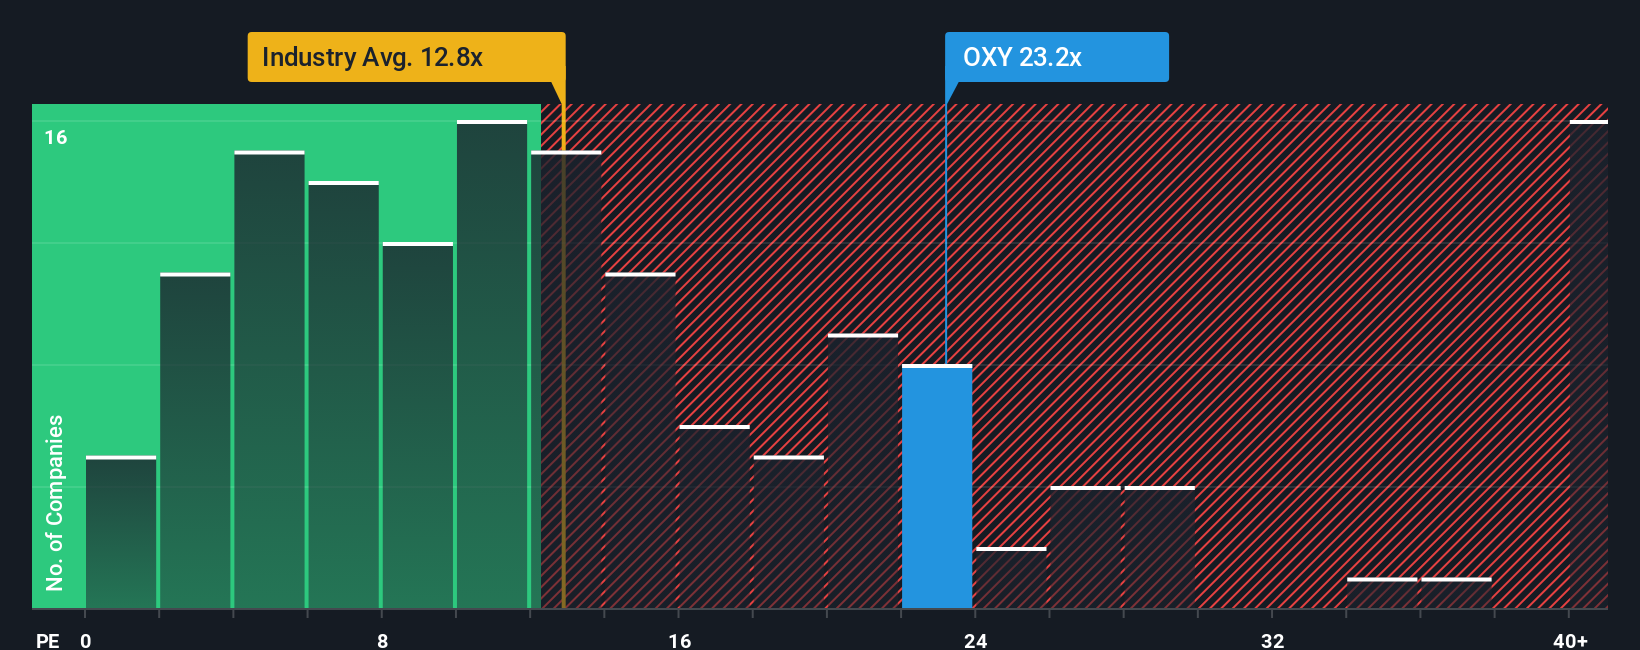
Generally, higher earnings growth outlooks and lower perceived business risks justify a higher “normal” PE ratio. In contrast, slower growth or elevated risks tend to pull that number down. Occidental Petroleum currently trades at a PE ratio of 23.2x. For context, this is slightly below its peer group average of 23.7x and well above the Oil and Gas industry average of 12.8x. So, it’s priced higher than most of its industry but in line with direct competitors.
To improve on these broad comparisons, Simply Wall St calculates a custom “Fair Ratio” of 19.8x for Occidental. Unlike simple industry averages, the Fair Ratio is designed to reflect the company’s unique mix of earnings growth potential, profit margins, risk profile, market cap, and the characteristics of its sector. This thorough approach delivers a more precise valuation anchor than just looking at other companies.
Since Occidental’s actual PE is 23.2x and its Fair Ratio is 19.8x, this suggests the stock is somewhat richly valued on earnings relative to its fundamentals.
Result: OVERVALUED
 NYSE:OXY PE Ratio as at Oct 2025
PE ratios tell one story, but what if the real opportunity lies elsewhere? Discover 1405 companies where insiders are betting big on explosive growth.
Upgrade Your Decision Making: Choose your Occidental Petroleum Narrative
Earlier we mentioned that there is a more insightful way to approach valuation, so let’s introduce you to Narratives. A Narrative is your personalized story about a company. It’s how you connect your expectations for Occidental Petroleum’s business, such as future revenues, earnings, and margins, with a financial forecast and your own estimate of fair value.
Narratives link what you believe about a company’s future with real numbers, making it much easier to see how your view matches up with market prices and consensus expectations. This tool is available to everyone on the Simply Wall St Community page, and it is already being used by millions of investors to make simpler, smarter decisions.
With Narratives, you can create, browse, and update investment cases for Occidental. For example, some investors see an optimistic scenario built on 16% profit margin improvement and aggressive carbon capture growth (with a fair value around $55 per share), while more cautious users have a fair value closer to $40, reflecting concerns about oil price volatility and execution risk.
Narratives stay up to date as new information, like earnings or news, enters the market. By comparing your Narrative’s fair value to the current share price, you can decide whether it is time to buy, sell, or watch. This gives you a dynamic, forward-looking way to invest that goes far beyond basic ratios.
Do you think there’s more to the story for Occidental Petroleum? Head over to our Community to see what others are saying!
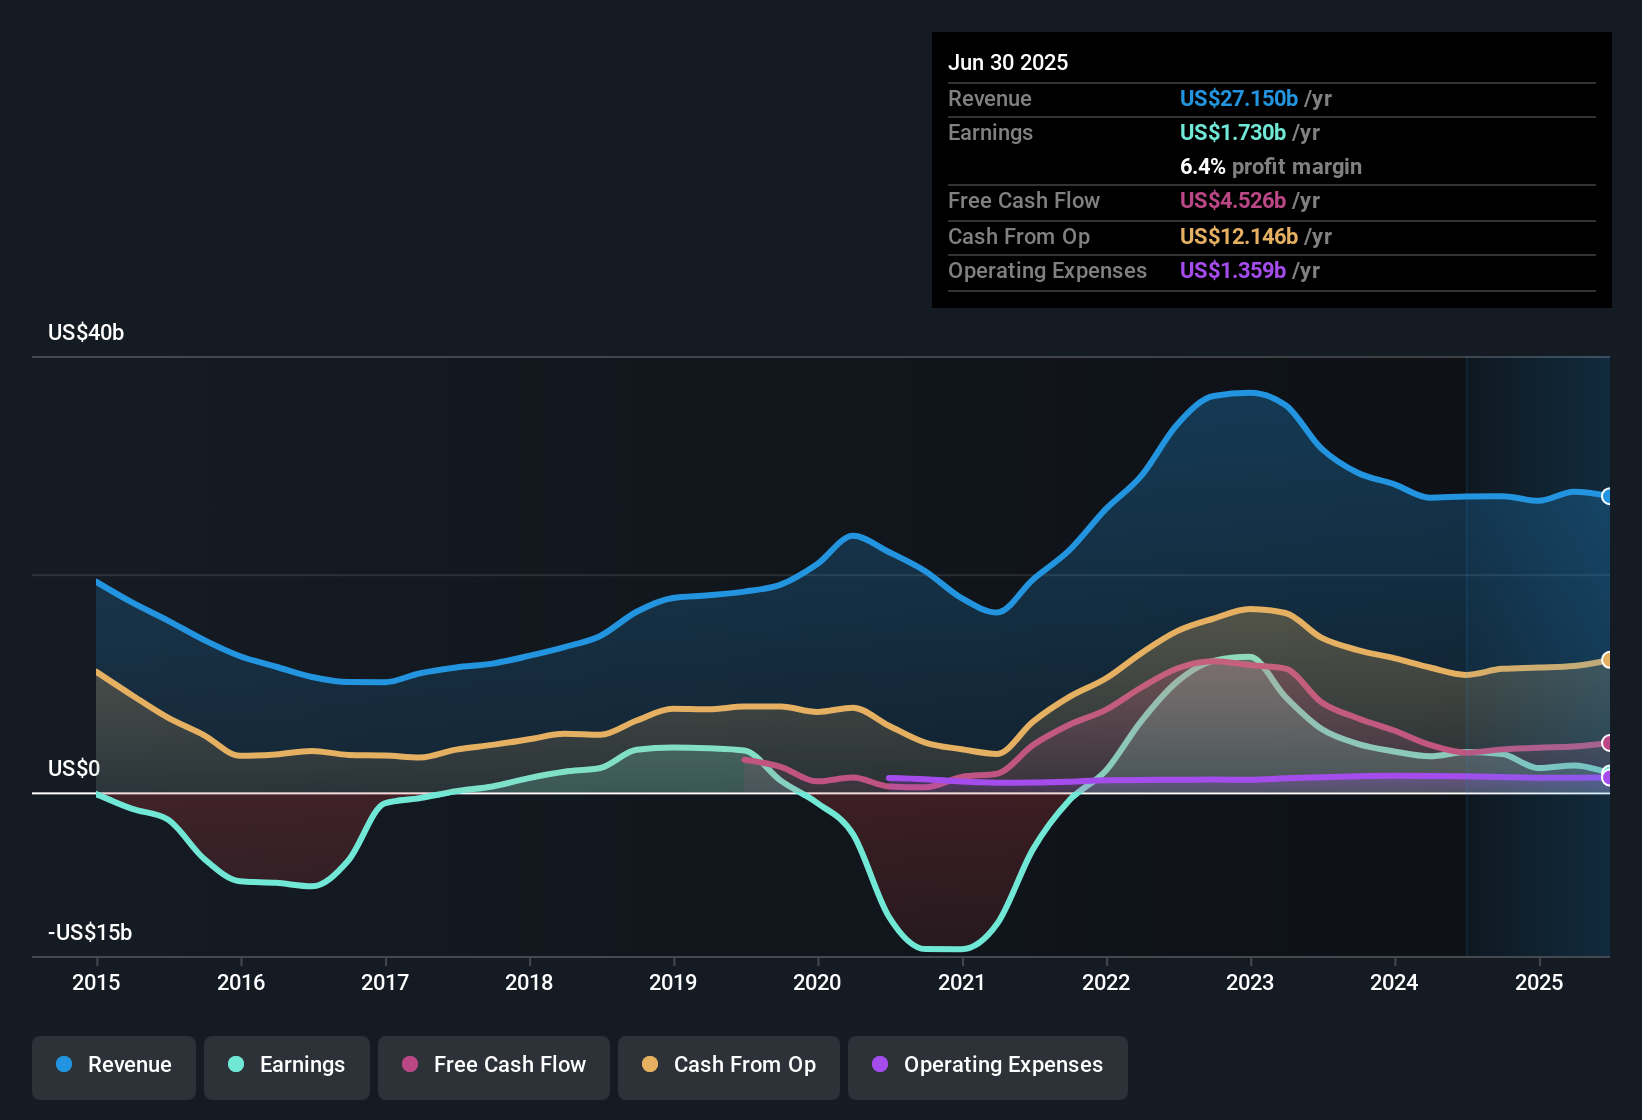 NYSE:OXY Earnings & Revenue History as at Oct 2025
This article by Simply Wall St is general in nature. We provide commentary based on historical data
and analyst forecasts only using an unbiased methodology and our articles are not intended to be financial advice. It does not constitute a recommendation to buy or sell any stock, and does not take account of your objectives, or your
financial situation. We aim to bring you long-term focused analysis driven by fundamental data.
Note that our analysis may not factor in the latest price-sensitive company announcements or qualitative material.
Simply Wall St has no position in any stocks mentioned.
Our new AI Stock Screener scans the market every day to uncover opportunities.
• Dividend Powerhouses (3%+ Yield)
• Undervalued Small Caps with Insider Buying
• High growth Tech and AI Companies
Or build your own from over 50 metrics.
Have feedback on this article? Concerned about the content? Get in touch with us directly. Alternatively, email editorial-team@simplywallst.com