
The crazy bubble in precious metals of recent months is a symptom of something bigger. Markets are increasingly uneasy about high levels of government debt and budget deficits that look out of control. It’s never clear ex ante at what point markets decide they’ve had enough and start an actual run on government debt. But it certainly looks like a slow-motion run has already started, with markets demanding higher long-term yields as compensation for the risk that debt will be inflated away. The scramble for safe havens from debt monetization is the “debasement trade” and the precious metals bubble is one particular manifestation of that.
In today’s post, I compare the rise in 30-year government bond yields across much of the G10 with central bank rate cuts. Central bank cuts should pull down yields across the curve, including at the very long end, but that hasn’t been happening during this easing cycle. That’s potentially a sign that – on average – markets are becoming more averse to holding government debt. This lens also highlights Germany and the UK as outliers, given that 30-year yields have risen disproportionately. The UK is obviously in market crosshairs already, but the softening up of the debt brake is also ringing alarm bells for Germany, which – along with Japan – is eroding its safe haven status.
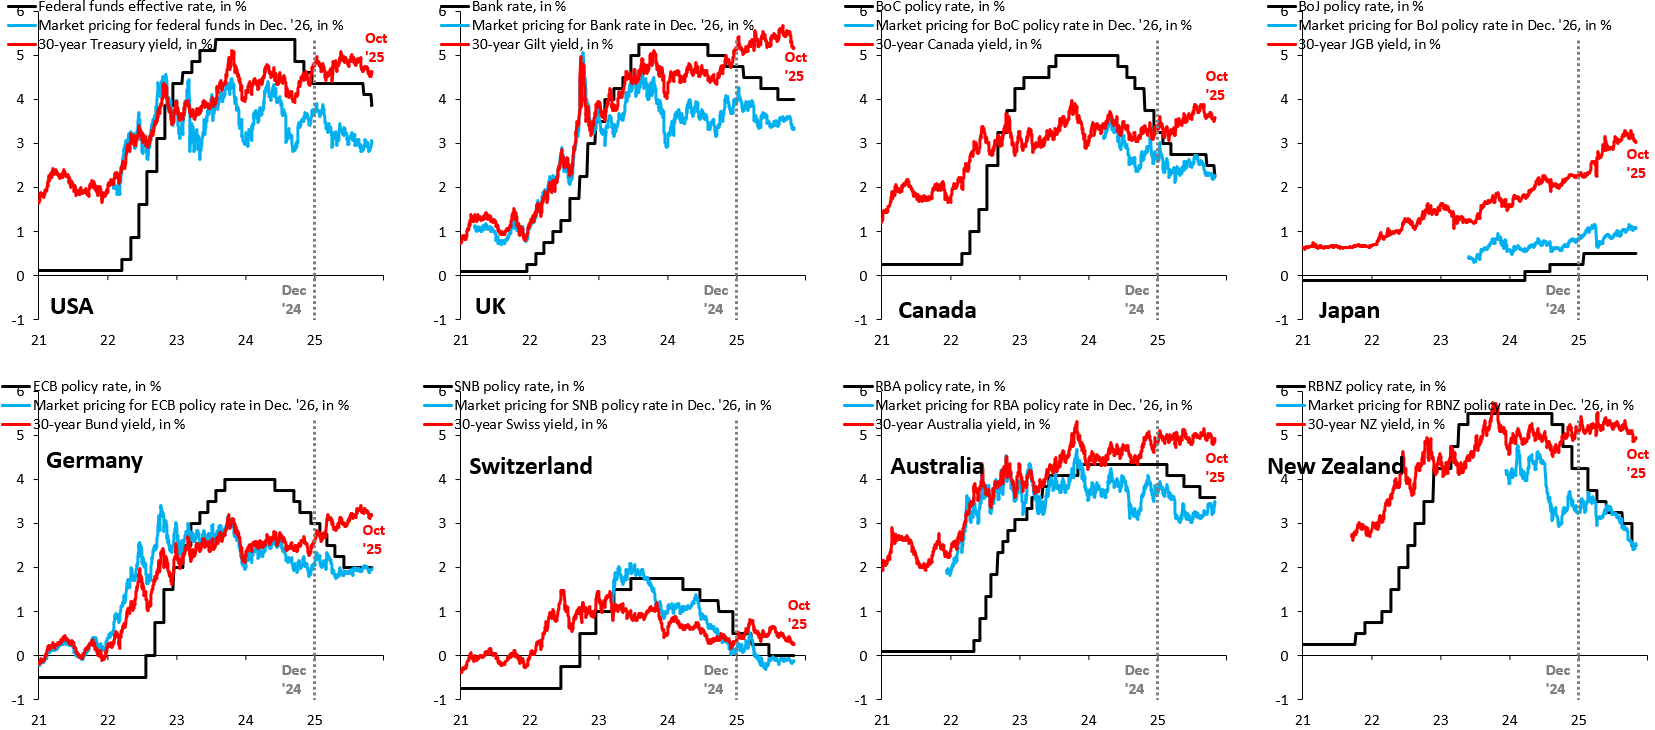
The black line in each of the charts above is the central bank policy rate. The blue line is what futures markets price for this policy rate at the end of next year. The red line is the 30-year government bond yield. A quick look already shows that long-term yields haven’t followed policy rates down. Japan is an outlier, as it’s the only place where the central bank is hiking. Not surprisingly, its 30-year yield has risen the most since the start of the global easing cycle in 2024.
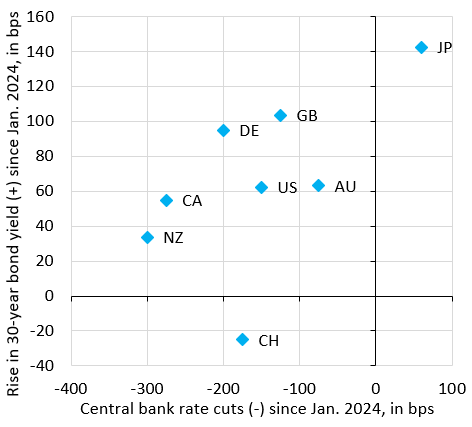
The chart above zooms in on the cross-country perspective. The horizontal axis shows cumulative cuts (-) made since January 2024. The vertical axis shows the rise (+) in the 30-year government bond yield since then. Three points are worth making. First, more rate cuts – on average – tend to hold down longer-term yields. That’s why Canada (CA) and New Zealand (NZ) are in the lower left corner of this chart, while Japan (JP) is in the upper right. This positive relationship is to be expected and normal. Second, the only place that’s seen a fall in its 30-year yield is Switzerland (CH), a reflection of its low debt and safe haven status. Third, Germany (DE) and the UK (GB) are outliers, in the sense that their 30-year yields look to have risen disproportionately. In contrast, and perhaps to the frustration of many, the US looks ok. The US continues to benefit from the fact that “there is no alternative” (TINA).
While the outlier status of the UK and Germany are notable, it’s the bigger picture that’s worrying. The fact that only one country – Switzerland – has seen falling yields amid a global central bank easing cycle is alarming. This is why I think there’s a slow-motion run on government debt and why the “debasement trade” will keep going.