
Nov 1, 2025
IndexBox has just published a new report: Northern America – Maize Oil – Market Analysis, Forecast, Size, Trends and Insights.
This analysis of the Northern American maize oil market from 2013 to 2024, with a forecast to 2035, reveals a complex landscape. Consumption in 2024 was 968K tons (valued at $1.3B), a decrease from previous years but still showing overall growth from 2013. The United States dominates, accounting for 93% of consumption and 91% of production. The market is forecast to grow slowly in volume (CAGR +0.3%) to 998K tons by 2035, but more robustly in value (CAGR +4.4%) to $2B. Trade dynamics show the region as a net exporter, though imports have seen recent volatility. The market is segmented into higher-priced refined oil and lower-priced crude oil, with distinct import and export patterns for each.
Key Findings
Market forecast to grow to 998K tons ($2B) by 2035 with slow volume but stronger value growthThe United States is the dominant force, constituting over 90% of both consumption and productionRegion is a net exporter, but exports have seen a significant long-term declineRefined maize oil commands a substantially higher price than crude oil in both imports and exports2024 saw a market contraction with consumption and production decreasing from recent peaksMarket Forecast
Driven by increasing demand for maize oil in Northern America, the market is expected to continue an upward consumption trend over the next decade. Market performance is forecast to decelerate, expanding with an anticipated CAGR of +0.3% for the period from 2024 to 2035, which is projected to bring the market volume to 998K tons by the end of 2035.
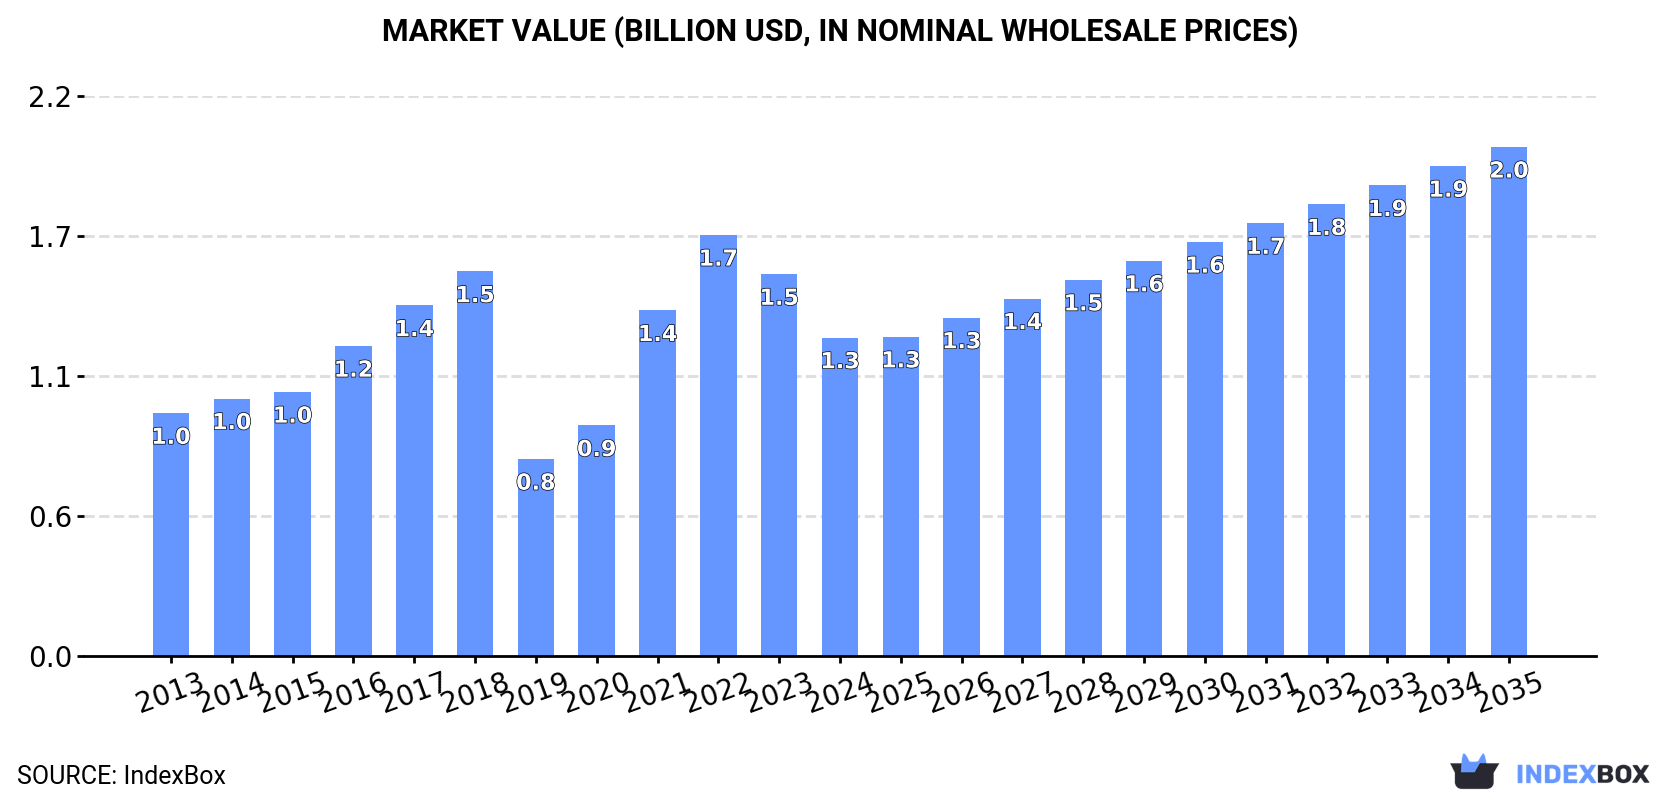
In value terms, the market is forecast to increase with an anticipated CAGR of +4.4% for the period from 2024 to 2035, which is projected to bring the market value to $2B (in nominal wholesale prices) by the end of 2035.
 ConsumptionNorthern America’s Consumption of Maize Oil
After four years of growth, consumption of maize oil decreased by -3.6% to 968K tons in 2024. The total consumption indicated a tangible increase from 2013 to 2024: its volume increased at an average annual rate of +2.7% over the last eleven years. The trend pattern, however, indicated some noticeable fluctuations being recorded throughout the analyzed period. Based on 2024 figures, consumption increased by +17.2% against 2019 indices. Over the period under review, consumption attained the maximum volume at 1.5M tons in 2018; however, from 2019 to 2024, consumption failed to regain momentum.
The revenue of the maize oil market in Northern America fell sharply to $1.3B in 2024, with a decrease of -16.6% against the previous year. This figure reflects the total revenues of producers and importers (excluding logistics costs, retail marketing costs, and retailers’ margins, which will be included in the final consumer price). The total consumption indicated a notable increase from 2013 to 2024: its value increased at an average annual rate of +2.5% over the last eleven years. The trend pattern, however, indicated some noticeable fluctuations being recorded throughout the analyzed period. Based on 2024 figures, consumption decreased by -24.4% against 2022 indices. Over the period under review, the market attained the peak level at $1.7B in 2022; however, from 2023 to 2024, consumption remained at a lower figure.
Consumption By Country
The United States (902K tons) constituted the country with the largest volume of maize oil consumption, accounting for 93% of total volume. Moreover, maize oil consumption in the United States exceeded the figures recorded by the second-largest consumer, Canada (66K tons), more than tenfold.
From 2013 to 2024, the average annual rate of growth in terms of volume in the United States amounted to +2.8%.
In value terms, the United States ($1.2B) led the market, alone. The second position in the ranking was held by Canada ($86M).
From 2013 to 2024, the average annual rate of growth in terms of value in the United States stood at +2.6%.
The countries with the highest levels of maize oil per capita consumption in 2024 were the United States (2.7 kg per person) and Canada (1.7 kg per person).
From 2013 to 2024, the biggest increases were recorded for the United States (with a CAGR of +2.2%).
ProductionNorthern America’s Production of Maize Oil
In 2024, production of maize oil in Northern America contracted modestly to 1.1M tons, remaining constant against the previous year’s figure. In general, production saw a relatively flat trend pattern. The pace of growth appeared the most rapid in 2015 when the production volume increased by 19%. Over the period under review, production attained the maximum volume at 1.8M tons in 2018; however, from 2019 to 2024, production remained at a lower figure.
In value terms, maize oil production shrank dramatically to $1.3B in 2024 estimated in export price. Overall, production, however, showed a relatively flat trend pattern. The pace of growth was the most pronounced in 2021 when the production volume increased by 64%. Over the period under review, production hit record highs at $1.9B in 2022; however, from 2023 to 2024, production remained at a lower figure.
Production By Country
The United States (986K tons) constituted the country with the largest volume of maize oil production, accounting for 91% of total volume. Moreover, maize oil production in the United States exceeded the figures recorded by the second-largest producer, Canada (96K tons), tenfold.
From 2013 to 2024, the average annual growth rate of volume in the United States was relatively modest.
ImportsNorthern America’s Imports of Maize Oil
In 2024, supplies from abroad of maize oil decreased by -39.1% to 56K tons, falling for the second consecutive year after two years of growth. In general, imports, however, enjoyed a modest expansion. The pace of growth appeared the most rapid in 2022 with an increase of 147%. As a result, imports reached the peak of 98K tons. From 2023 to 2024, the growth of imports remained at a somewhat lower figure.
In value terms, maize oil imports shrank dramatically to $71M in 2024. Overall, imports, however, saw a tangible increase. The most prominent rate of growth was recorded in 2022 when imports increased by 106%. Over the period under review, imports attained the peak figure at $112M in 2023, and then dropped sharply in the following year.
Imports By Country
In 2024, the United States (46K tons) represented the largest importer of maize oil, generating 83% of total imports. It was distantly followed by Canada (9.4K tons), committing a 17% share of total imports.
The United States was also the fastest-growing in terms of the maize oil imports, with a CAGR of +5.5% from 2013 to 2024. Canada (-7.8%) illustrated a downward trend over the same period. From 2013 to 2024, the share of the United States increased by +30 percentage points.
In value terms, the United States ($57M) constitutes the largest market for imported maize oil in Northern America, comprising 81% of total imports. The second position in the ranking was taken by Canada ($13M), with a 19% share of total imports.
From 2013 to 2024, the average annual growth rate of value in the United States amounted to +5.9%.
Imports By Type
Refined maize (corn) oil represented the key imported product with an import of around 32K tons, which reached 58% of total imports. It was distantly followed by crude maize (corn) oil (24K tons), creating a 42% share of total imports.
From 2013 to 2024, the most notable rate of growth in terms of purchases, amongst the key imported products, was attained by crude maize (corn) oil (with a CAGR of +6.3%).
In value terms, refined maize (corn) oil ($48M) constitutes the largest type of maize oil imported in Northern America, comprising 68% of total imports. The second position in the ranking was held by crude maize (corn) oil ($22M), with a 32% share of total imports.
From 2013 to 2024, the average annual rate of growth in terms of the value of refined maize (corn) oil imports was relatively modest.
Import Prices By Type
In 2024, the import price in Northern America amounted to $1,266 per ton, picking up by 3.6% against the previous year. Over the period from 2013 to 2024, it increased at an average annual rate of +1.1%. The most prominent rate of growth was recorded in 2023 when the import price increased by 26% against the previous year. Over the period under review, import prices attained the peak figure in 2024 and is likely to see steady growth in years to come.
There were significant differences in the average prices amongst the major imported products. In 2024, the product with the highest price was refined maize (corn) oil ($1,507 per ton), while the price for crude maize (corn) oil totaled $940 per ton.
From 2013 to 2024, the most notable rate of growth in terms of prices was attained by refined maize oil (+2.0%).
Import Prices By Country
The import price in Northern America stood at $1,266 per ton in 2024, growing by 3.6% against the previous year. Over the period from 2013 to 2024, it increased at an average annual rate of +1.1%. The pace of growth was the most pronounced in 2023 when the import price increased by 26%. Over the period under review, import prices hit record highs in 2024 and is expected to retain growth in the near future.
Average prices varied noticeably amongst the major importing countries. In 2024, amid the top importers, the country with the highest price was Canada ($1,433 per ton), while the United States amounted to $1,232 per ton.
From 2013 to 2024, the most notable rate of growth in terms of prices was attained by Canada (+2.9%).
ExportsNorthern America’s Exports of Maize Oil
In 2024, the amount of maize oil exported in Northern America reduced slightly to 170K tons, with a decrease of -2.6% on the previous year. Over the period under review, exports saw a abrupt descent. The pace of growth appeared the most rapid in 2015 with an increase of 25%. As a result, the exports reached the peak of 514K tons. From 2016 to 2024, the growth of the exports remained at a lower figure.
In value terms, maize oil exports shrank notably to $205M in 2024. Overall, exports saw a abrupt contraction. The most prominent rate of growth was recorded in 2021 with an increase of 54%. The level of export peaked at $530M in 2013; however, from 2014 to 2024, the exports remained at a lower figure.
Exports By Country
The United States was the main exporter of maize oil in Northern America, with the volume of exports accounting for 130K tons, which was near 77% of total exports in 2024. It was distantly followed by Canada (40K tons), mixing up a 23% share of total exports.
From 2013 to 2024, average annual rates of growth with regard to maize oil exports from the United States stood at -10.6%. At the same time, Canada (+4.7%) displayed positive paces of growth. Moreover, Canada emerged as the fastest-growing exporter exported in Northern America, with a CAGR of +4.7% from 2013-2024. Canada (+18 p.p.) significantly strengthened its position in terms of the total exports, while the United States saw its share reduced by -18.3% from 2013 to 2024, respectively.
In value terms, the United States ($156M) remains the largest maize oil supplier in Northern America, comprising 76% of total exports. The second position in the ranking was held by Canada ($49M), with a 24% share of total exports.
In the United States, maize oil exports contracted by an average annual rate of -10.1% over the period from 2013-2024.
Exports By Type
In 2024, crude maize (corn) oil (99K tons) was the major type of maize oil, constituting 58% of total exports. It was distantly followed by refined maize (corn) oil (71K tons), generating a 42% share of total exports.
From 2013 to 2024, the biggest increases were recorded for refined maize (corn) oil (with a CAGR of -8.0%).
In value terms, the largest types of exported maize oil were crude maize (corn) oil ($104M) and refined maize (corn) oil ($101M).
Refined maize (corn) oil, with a CAGR of -7.0%, recorded the highest growth rate of the value of exports, in terms of the main exported products over the period under review.
Export Prices By Type
The export price in Northern America stood at $1,208 per ton in 2024, with a decrease of -17.8% against the previous year. Overall, the export price, however, showed a relatively flat trend pattern. The most prominent rate of growth was recorded in 2021 an increase of 56% against the previous year. The level of export peaked at $1,513 per ton in 2022; however, from 2023 to 2024, the export prices failed to regain momentum.
Average prices varied somewhat amongst the major exported products. In 2024, the product with the highest price was refined maize (corn) oil ($1,420 per ton), while the average price for exports of crude maize (corn) oil totaled $1,054 per ton.
From 2013 to 2024, the most notable rate of growth in terms of prices was attained by refined maize oil (+1.1%).
Export Prices By Country
In 2024, the export price in Northern America amounted to $1,208 per ton, waning by -17.8% against the previous year. In general, the export price, however, saw a relatively flat trend pattern. The most prominent rate of growth was recorded in 2021 an increase of 56% against the previous year. Over the period under review, the export prices reached the peak figure at $1,513 per ton in 2022; however, from 2023 to 2024, the export prices stood at a somewhat lower figure.
Average prices varied noticeably amongst the major exporting countries. In 2024, amid the top suppliers, the country with the highest price was Canada ($1,223 per ton), while the United States amounted to $1,203 per ton.
From 2013 to 2024, the most notable rate of growth in terms of prices was attained by Canada (+0.7%).