An a priori power analysis was conducted using MorePower Ver. 6.023 to determine the minimum sample size required for the planned analyses. The analysis targeted the detection of a two-way interaction (Cue × Target) and a three-way interaction (Task × Cue × Target) in a repeated measures ANOVA. Based on partial η² of 0.096 reported in Shaki and Fischer9 for the three-way interaction, α = 0.05, and a desired power of 0.80, the results indicated that at least 48 participants would be required to reliably detect the expected effects. This sample size was proven sufficient in another study by Shaki and Fischer10 who obtained a partial η2 of 0.184 for the three-way interaction and a partial η2 of 0.301 for the two-way interaction with a sample of 46 participants. Because eye-tracking studies often involve data loss due to blinks or calibration difficulties, we recruited slightly more participants than the minimum suggested.
A total of 63 native Hebrew-reading Israeli adults were recruited from the student population of Ariel, Israel. There were 19 males and 44 females with ages ranging from 20 to 32 years (mean: 23.5 years). Exclusion criteria were: (a) reported history of learning disabilities/brain injuries/memory decrease/visual impairments/prescription glasses; (b) consumption of drugs on the day of the experiment; and (c) wearing eye makeup, such as mascara and eye-liner, to ensure good quality eye tracking. All participants received course credit in exchange for their participation.
Stimuli
The stimuli set was informed by previous work and consisted of three Hebrew words associated with upper locations (meaning: hat, roof, tower) and three Hebrew words associated with lower locations (meaning: carpet, floor, basement). All Hebrew words were 4 letters long and shown in black Arial font with 35-point size on white background. The lexical frequencies for the two sets of cue words were tested using the M1 corpus by the National Institute for Testing and Evaluation24. The lexical frequencies of words associated with upper locations (mean = 22.46, SD = 4.85) and words associated with lower locations (mean = 17.35, SD = 3.79) were similar. Three additional non-word letter sequences with similar lengths were used in the lexical decision task. Five additional words of animated objects with similar lengths were used in the non-spatial categorization task (sheep, woman, donkey, snake, bird). Cues were displayed at the centre of the screen, while the target letter (“X”) in a 20-point “Times New Roman” font appeared 8° vertically above or below the centre of the display (cf9,10. Responses were made by pressing the space bar of a QWERTY keyboard centred in front of the screen with the dominant hand. All other keyboard keys were covered.
Apparatus
The experiment was programmed using the EyeLink Experiment Builder software package (SR Research Ltd., version 2.4.77). Eye tracking was performed binocularly using the EyeLink Portable Duo eye-tracker (SR Research Ltd., Ontario, Canada) at a sampling rate of 500 Hz. The signals of horizontal and vertical gaze positions from both eyes were averaged across all selected non-blink samples in a current bin. The stimuli were displayed on an AOC 2470 W 23-inch display screen (1920 × 1080 pixels resolution and 60 Hz refresh rate). The presentation of task instructions, stimuli, event timing and response recording was controlled by Experiment-Builder software.
Design
In task 1 (lexical decision) there were 72 trials, comprising 24 catch trials (12 ‘real’ words without target and 12 non-words) and 48 experimental trials (66.7% go trials). These latter trials reflected the complete crossing of two SOAs (500 and 700 ms), two target locations (above, below), and six cue words. These 24 trials were randomly presented twice with randomly chosen exemplars of each prime type.
In task 2 (non-spatial categorization) there were also 72 trials, comprising 24 catch trials (12 spatial connotative words without target and 12 animal names) and 48 experimental trials (66.7% go trials). These latter trials reflected the complete crossing of two SOAs, two target locations, and six prime words. These 24 trials were randomly presented twice with randomly chosen exemplars of each prime type.
In task 3 (spatial categorization) there were 144 trials, due to two response rules in separate counterbalanced blocks, reflecting the two prime meanings. In each block there were 72 trials, of which 24 were catch trials (12 go-words without target and 12 no-go words) and 48 experimental trials (66.7% go trials). Go trials reflected two SOAs, two target locations and three cue words. These 12 trials were randomly presented four times in each of the two rule conditions.
These three tasks were administered in a counterbalanced order to benefit from a statistically advantageous within-participant design. As a result, there were relatively few trials per task to prevent exhaustion of participants in this attention testing study. The potential concern about reduced statistical power was compensated by the large sample size (see above).
Procedure
This study was approved by the Ethics Committee of Ariel University (reference number AU-SOC-SS-20190204-1). The research procedure complied with the guidelines and regulations based on the Declaration of Helsinki. Informed consent was obtained from all participants prior to their involvement in the study. Personal data were collected only for administrative purposes (awarding course credit) and kept confidential. Published data are fully anonymized, ensuring no personal information was disclosed. The experiment was conducted in the Cognition Lab at Ariel University in a room with controlled lighting (but no natural light). The distance from the participant’s eye to the display screen was 78 cm while using a chin rest to ensure maximum accuracy. Before the task began, each participant was instructed to gaze toward five drifting points on the screen for eye tracker calibration. After completing the calibration, a one-point drift correction was performed after the task instructions had appeared on the screen but before data collection started. Participants were instructed to quickly and accurately make a go/no-go decision in each trial according to the response rule (see Table 1). All participants worked on the three tasks in a counterbalanced order, always beginning with eight practice trials.
All trials consisted of two successive visual onsets: a lexical cue at fixation, to which participants did not overtly react; and a vertically displayed target to which they made their decision depending on the go rule (see Table 1).
Each trial was initiated by a central fixation dot presented for 250 ms. Then, the cue was presented for 250 ms and disappeared. Finally, the target was presented after one of two different randomly chosen SOAs (500 or 700 ms) and remained visible until the participant’s response or 2000 ms had elapsed (also in no-go trials). Reaction time (RT) was defined as the time from target onset until the participant’s response on the space bar. No feedback was given, regardless of whether the response was correct or not.
Analysis
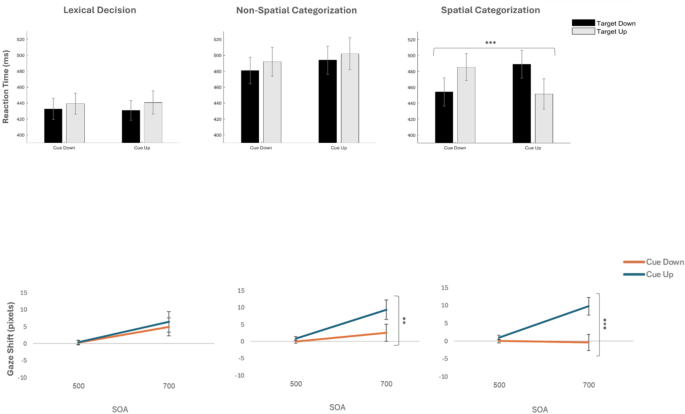
A total of 63 participants were tested but one did not complete all sessions and was excluded from analyses. Practice and no-go trials were not analysed. Considering manual responses, 246 trials (1.4%) reflected anticipatory responses in catch trials and 814 trials (4.5%) reflected omitted responses in go trials. Eight participants with more than 20% errors were excluded. Error trials of the remaining 54 participants ranged only from 0% to 17%. Finally, RTs for go trials outside of the mean and 2.5 standard deviations from the group mean were excluded (26 trials). After this data trimming to ensure high-quality results, the remaining trials were analysed with repeated measures analyses of variance (ANOVA) that evaluated the effects of 3 Task Instructions (lexical decision, non-spatial categorization, spatial categorization; see Table 1), 2 Implied Cue Directions (down, up), 2 Target Locations (down, up) and 2 SOAs (500 and 700 ms) on correct RTs. Congruent cue-target relations (up-up and down-down) were subtracted from incongruent cue-target relations (up-down, down-up) to compute congruency effects. Results appear in Fig. 1 (upper panels).
Considering eye movement data, these were stored as .EDF files in the EyeLink Data Viewer 4.3.21 (SR Research Ltd., Oakville, Ontario, Canada) and later exported to Excel. We wrote a MATLAB code (The MathWorks Inc., 2019) to pre-process the eye position recordings in five steps: First, trials with more than 25% of recordings missing were excluded from the analysis (291 trials). Second, recordings for which manual RTs fell outside of the mean and 2.5 standard deviations from the group mean were excluded (26 trials, as above). Third, we excluded recordings in which eye position of either eye fell outside the screen (25 trials). Fourth, we created 50-millisecond bins to evaluate eye positions during the inter-stimulus interval when the screen was blank (for either 250 ms in the 500 ms SOA; or 450 ms in the 700 ms SOA). We converted eye position data into gaze shifts, corresponding to the difference in average gaze position between subsequent bins (cf25. For each trial, the sum of gaze shifts along the Y-axis (in pixels) was calculated from the cue word disappearance to the appearance of the target, thus reflecting the vertical eye position change over 5 or 11 averages, respectively (for the two SOA conditions). For example, if the average vertical fixation coordinates from two adjacent bins were 10 and 50, respectively, the resulting gaze shift would be + 40, indicating an upwardly displaced start and further upward displacement of eye position at the beginning of the blank screen interval. Positive values corresponded to upward shifts, and negative values corresponded to downward shifts of eye position. It is important to note that we did not analyse eye movements along the X-axis because both cues and targets appeared horizontally centred on the screen. In order to calculate gaze shifts, we need to compare successive eye positions to the position of the eye at the beginning of the blank screen. Therefore, we excluded trials with missing eye position data from the first bin (2 trials or 0.02%). Fifth and last, we linearly interpolated the remaining data to fill in the missing data caused by blinks or random data loss (64 trials or 2.65%). In the lexical decision, non-spatial, and spatial categorization tasks, 92.37%, 91.92% and 92.94% of all fixations fell on the lexical cues, respectively, indicating close overt attention to the cues and thus task compliance in all conditions. Importantly, no cases were removed from the data set so that RT results and gaze results come from the same set of participants.
After this data trimming to ensure high-quality results, the remaining trials were analysed with repeated measures analysis of variance (ANOVA) that evaluated the effects of 3 Task Instructions (lexical decision, non-spatial categorization, spatial categorization; see Table 1), 2 Implied Cue Directions (down, up) and 2 SOAs (500 and 700 ms) on gaze shifts. Given that all eye data were collected prior to target onsets (which would trivially capture overt attention), no meaningful congruency computation was possible. Results appear in Fig. 1 (lower panel). All results were statistically evaluated with SPSS version 29. All raw data, the analysis script, and result tables are available at https://osf.io/y8ntm/.