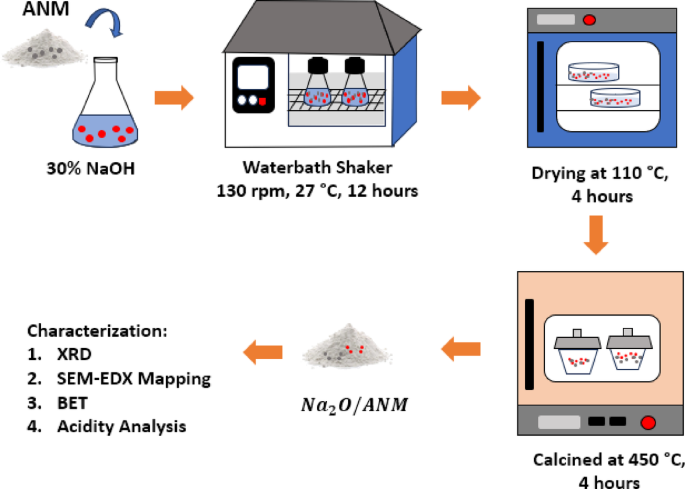
The natural zeolite used in this study was obtained from South Malang, Indonesia. Natural zeolites have different compositions and crystallinity, depending on their geological source. A pre-treatment process involving washing, acid activation, and ion exchange was performed to enhance consistency and remove impurities2,36. The activation of natural zeolite in this study was carried out physically and chemically. Physically, zeolite activation is carried out by grinding, sifting, and heating zeolite at high temperatures. Physical activation aims to separate impurities, obtain uniform size, and increase the surface area of zeolite37. The zeolite that has been physically activated changes colour from green to brown as shown in Fig. 3a, b, due to the oxidation of Fe2+ ions to Fe3+ after calcination. In addition, the activation process can lead to zeolite dehydration, followed by increased Fe oxide levels, which causes the zeolite to darken in colour37.
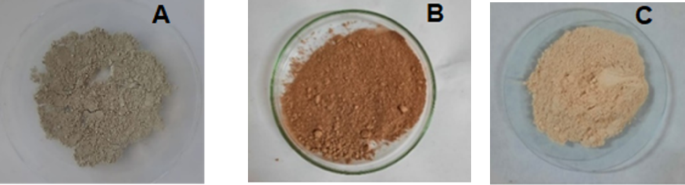
(A) Natural mordenite before activation, (B) Natural mordenite after physical activation, (C) Natural mordenite after chemical activation (ANM).
Chemical activation was performed by dispersing zeolite into HF and HCl solutions to reduce zeolite’s free silica, alumina, and metal contaminants and increase the pore size of zeolite2. The reduction of metal contaminants is characterised by a change in zeolite colour from brown to pale yellow, as shown in Fig. 3c. These results are consistent with those reported in previous studies2,38. Meanwhile, the activation with NH4Cl aims to exchange the charge-balancing metal of the zeolite framework with ammonium ions (NH4+) from NH4Cl. The ammonium ions will be released as NH3 gas through heating at high temperatures (500 °C) so that H-Zeolite is obtained38,39.
Table 1 provides the chemical analysis by using XRF. It is noticed that Natural Zeolites contain impurity atoms such as Fe, Ti, Mn, Cu, Zn, with a total of above 26%. These atoms originated from the impurities in the mineral in natural zeolite. The XRF result indicates that after the chemical activation process with acids, the percentage of impurity metal oxides, such as Fe, is decreased from 25.6% to 4.41%. The decrease of metal impurity was followed by an increase in the Si/Al ratio in zeolite from 6.48 to 8.940. This result is in good agreement with the previous report that the natural mordenite zeolite is silica-rich2,26. An increase in the Si/Al ratio can improve the stability of zeolite at high temperatures, and also can increase the acidity of zeolite41,42.
Natural zeolite commonly consists of multiple zeolitic phases, including Analcime, Clinoptilolite, Faujasite, Mordenite, and others, which are greatly influenced by the zeolite’s origin. Therefore, X-ray diffraction (XRD) characterisation is needed to determine the type of zeolite present in the natural zeolite used in this study. Figure 4 depicts the XRD profile of the Activated Natural Zeolite obtained from South Malang, Special Region of Jawa Timur, Indonesia. The XRD profile indicated that mordenite is the primary structure of the Activated Natural Zeolite. The mordenite peaks appeared at 2θ = 13.44°, 22.2°, 25.62°, 26.24°, and 27.66° (COD ID 9005607). This result agrees with the previous report on using zeolite obtained from South Malang, Jawa Timur, Indonesia2,38. The highest typical peak of mordenite is shown at 2θ = 25.62° and 27.66° (JCPDS: 700232). These results suggest that the activation process does not cause crystallinity damage to zeolites, consistent with those reported in previous studies2.
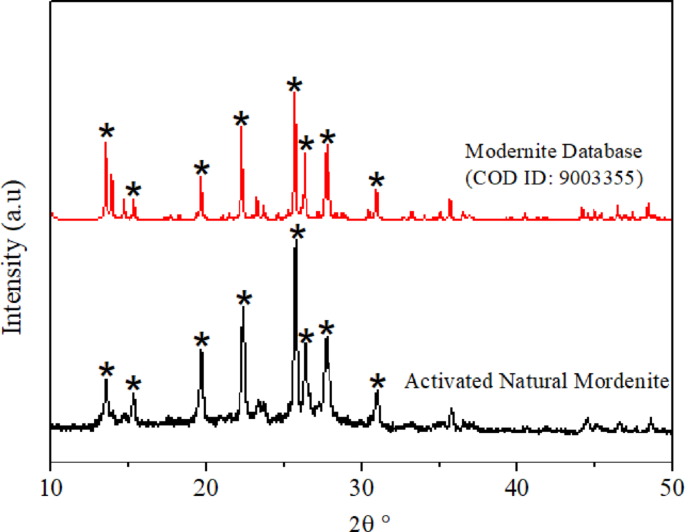
XRD Activated natural mordenite zeolite and standard mordenite database.
Characterisation of Na2O/activated natural mordenite (ANM) catalyst
Na2O/Activated Natural Mordenite (ANM) catalyst samples were characterised to analyse their physicochemical properties using XRD, SEM–EDX Mapping, BET, and Acidity Analysis.
XRD analysis
The results of XRD analysis of Na2O/ANM catalyst samples are shown in Fig. 5. The catalyst diffractogram shows that activated natural mordenite zeolite impregnated with metal oxide Na2O retains the specific peaks typical of activated natural zeolite with high intensity in 2θ = 25.63°. Some of the typical peaks of zeolite appear to have decreased in intensity, as shown at 2θ = 13.45°. It is possible due to the distribution of Na2O particles and the presence of amorphous Na2O particles. The impregnated Na2O particles are also dispersed into the zeolite frameworks so that at the time of XRD testing, the Na2O peaks become shallow and undetectable on the catalytic diffraction pattern. This result is in line with the findings reported by Sumari et al. and Kusuma et al., who synthesize activated natural zeolite impregnated with K2O17,43. Overall, the catalytic diffraction pattern shows that the activated natural zeolite (ANM) does not undergo significant structural changes after the impregnation process2,22,44.
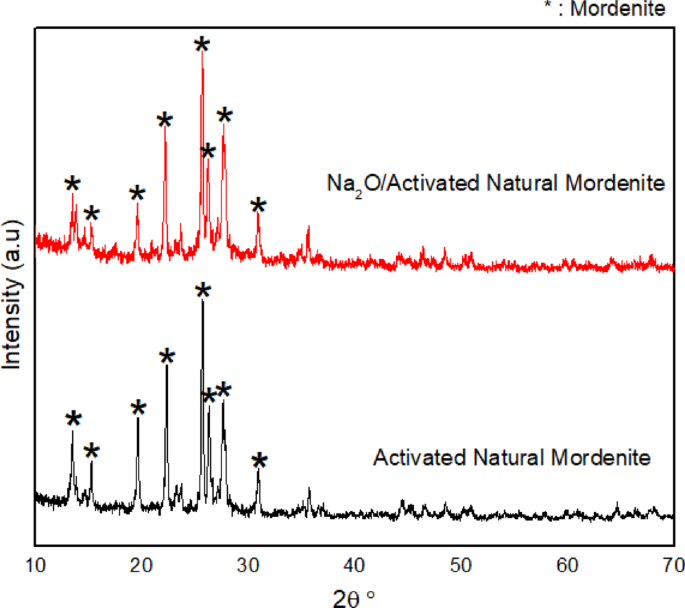
XRD results of activated natural mordenite before and after impregnation with Na2O.
BET analysis
The Brunauer–Emmett–Teller (BET) method, based on N2 gas adsorption–desorption, was used to measure specific surface area and zeolite pore size before and after Na2O impregnation. Results of BET’s analysis in Table 2 showed that after the impregnation, the activated natural decreased its specific surface area from 240.7 m2/g to 55.78 m2/g and its total pore volume from 0.19 cm3/g to 0.05 cm3/g. Wu et al. have reported a similar result that Y zeolite experienced a decrease in surface area and total pore volume after impregnation with CaO metal oxide45.
A decrease in the specific surface area and pore volume of zeolite can occur due to the filling of zeolite pores by metal oxide Na2O46. The results of BET measurements also showed that the pore diameter of zeolite increased along with Na2O impregnation from 2.46 to 3.66 nm. An increase in pore size can occur due to the reduction of amorphous aluminosilicate and the partial destruction of small zeolite cages due to alkaline treatment47. These results show that the metal oxide Na2O has been successfully impregnated into the pores and surface of the zeolite.
SEM–EDX mapping analysis
The analysis using SEM–EDX Mapping (Scanning Electron Microscopy with Energy Dispersive X-ray) was used to observe the morphological changes and distribution of Na2O particles in activated natural mordenite zeolite. The SEM image of natural mordenite zeolite (Fig. 6a) at 10,000 × magnification shows irregular morphology. This phenomenon occurs due to metal oxides of impurities left over during activation, as reported in previous studies2. However, after impregnation with Na2O, SEM images of the catalyst at 50,000 × magnification (Fig. 6b) show that the zeolite appears agglomerated and exhibits a different morphology from the activated natural zeolites. However, similar results have been reported that the morphology of zeolite impregnated with KOH can turn amorphous due to the partial collapse of the structure of mordenite zeolite48.
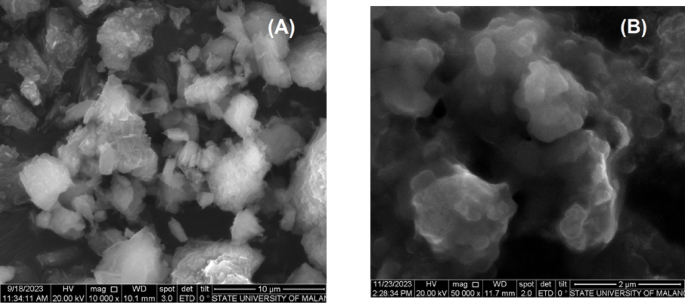
SEM results (a) Activated natural mordenite zeolite (ANM), (b) Na2O/ANM.
The presence of impregnated Na2O in activated natural mordenite zeolite is confirmed by SEM–EDX Mapping of the catalysts as shown in Fig. 7. The results show that the Na2O particles are fairly evenly distributed on the surface of the zeolite, indicated by the green colour area with a percentage of Na element of 15.6% of the total weight. It indicates that the process of Na2O impregnation has been successfully carried out, as has been reported in previous studies2,32.
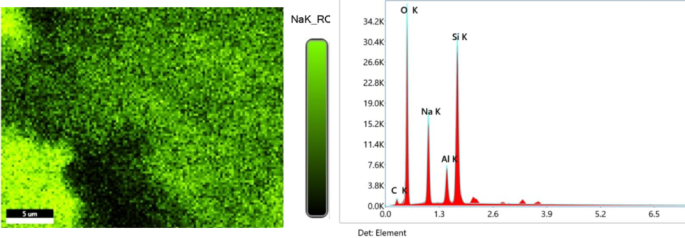
SEM–EDX mapping results of Na2O/activated natural mordenite catalyst.
Acidity analysis of the Na2O/ANM catalyst
The acidity analysis aims to quantify the number of acidic sites using a gravimetric method through ammonia adsorption under vacuum conditions in a desiccator pre-saturated with ammonia vapor. The acidity result of the Na2O/ANM catalyst and Activated Natural Mordenite (ANM) was presented in Table 3.
As shown in Table 3, the amount of adsorbed basic ammonia adsorbed by Activated Natural Mordenite (ANM) after impregnation with Na2O is significantly lower than before. This indicates that the acidic sites on ANM were largely replaced by strong basic sites due to the incorporation of Na2O. That process reduces the number of acidic sites that are available to interact with basic ammonia, thereby decreasing the catalyst’s acidity and increasing its basicity.
CPO pretreatment and characterization
The low grade crude palm oil (CPO) used in this study was obtained from PT. Sawit Arum Madani, located in Blitar, East Java, Indonesia. This oil exhibited typical characteristics of degraded feedstock, including a thick, margarine-like texture, a strong odor, and a yellow orange color, as shown in Fig. 8a. In addition, the low grade CPO contained a high level of free fatty acids (approximately 20%) and exhibited a very high kinematic viscosity of 18.83 cSt, which is unsuitable for direct use in biodiesel production. To enhance its quality and make it more suitable as a biodiesel feedstock, the low grade CPO underwent three sequential pretreatment steps: refining, degumming, and esterification.
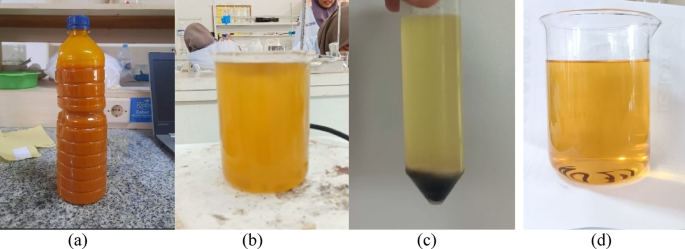
(a) low grade CPO before the pretreatment process, (b) The refined low grade CPO, (c) The degummed low grade CPO, (e) The esterified low grade CPO.
The refining process was carried out using bleaching earth to remove impurities, reduce color intensity, and minimize the unpleasant odor. Solid adsorbents such as bleaching earth are often preferred over other materials like activated carbon due to their lower cost and relatively high adsorption capacity33. After the refining process, the oil turned cloudy yellow in appearance, as shown in Fig. 8b, and no longer emitted a strong odor. These changes indicate the effective removal of volatile impurities and pigments, consistent with previous findings49.
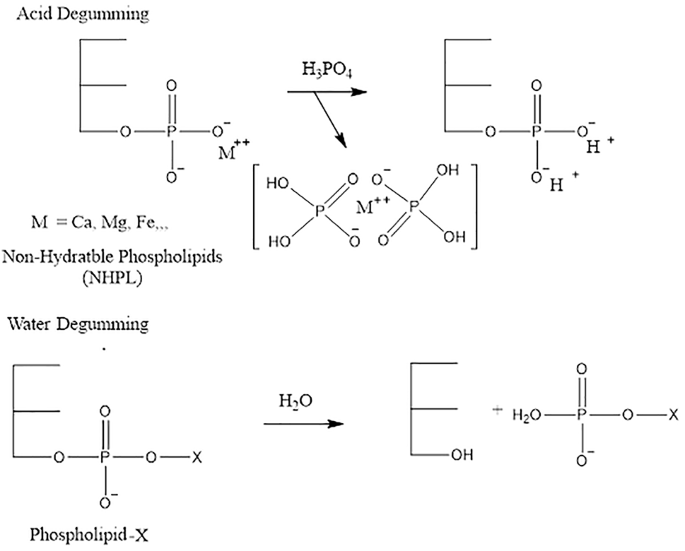
Despite the improvement, the refined oil still appeared slightly opaque as shown in Fig. 8b, indicating the possible presence of phospholipids and gum-like impurities. Therefore, a degumming process was carried out in two steps: acid degumming using a phosphate compound and water degumming. Acid degumming was performed to remove non-hydratable phospholipids by adding phosphoric acid. The acid acts by coagulating non-hydratable phosphatides along with metal ions present in the oil33. Acid degumming is typically followed by water degumming to remove hydratable gums (Kulkarni dkk50.). The reaction mechanism of acid degumming using phosphoric acid is illustrated bellow51:.
Following this treatment, the oil exhibited improved clarity, and a dark-colored gum was visibly separated and settled at the bottom of the container as shown in Fig. 8c, confirming the successful removal of polar contaminants. However, the degummed low grade CPO still had a high free fatty acid (FFA) content (approximately 18%) and exhibited a very high kinematic viscosity of 17.02 cSt, considering unsuitable for direct use in biodiesel production. To reduce the FFA for base-catalyzed transesterification, an esterification step was carried out. The esterified low grade CPO exhibited a significant reduction in free fatty acid (FFA) content, from 20 to 2.04%, which meets the acceptable limit for base-catalyzed transesterification. In addition, the oil became noticeably clearer as shown in Fig. 8d and free from strong odors. These results indicate that the pretreatment of low grade CPO was successfully carried out.
Process optimization in sonotransesterification of low grade CPO with Na2O/ANM catalyst
The process of transesterification is carried out with the help of ultrasonic waves using a 37 kHz waterbath ultrasonic. The transesterification reaction begins with the withdrawal of methanol protons by the metal oxide Na2O impregnated in zeolite, further producing anions methoxide. The methoxide anion then attacks the C carbonyl atom on the triglyceride, forming a carbonyl alkoxy intermediate. This process continues until 3 mol of methyl ester are obtained52. The final product of methyl ester can be seen in Fig. 9.
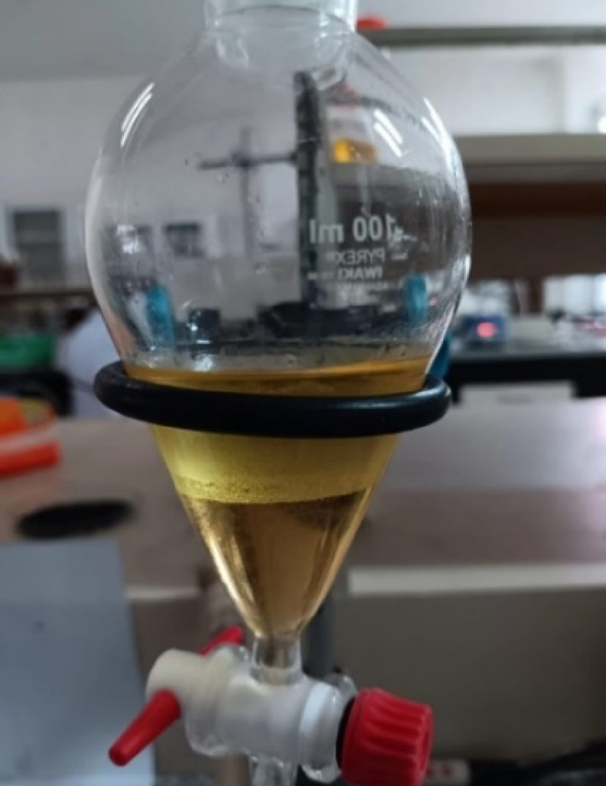
Sonotransesterification results of Na2O/ANM catalysed low grade CPO.
The highest yield was obtained at a reaction temperature of 65 °C for 60 min, which was 80.08%. At higher temperatures (> 65 °C), the yield of biodiesel appears to decrease because some of the methanol has evaporated at 75 °C, considering that the boiling point of methanol is 64.7 °C53,54. Moreover, at higher temperatures, the cavitation effect generated by ultrasonic waves can be weakened, followed by a decrease in biodiesel yield7. The biodiesel yields also experienced an increasing trend along with the increase in reaction time, as shown in Fig. 10.
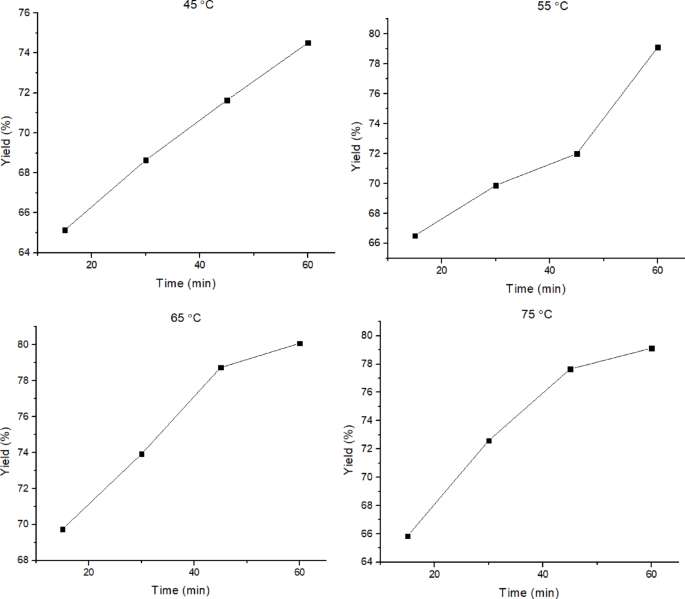
The effect of time on biodiesel yield at temperature: (a) 45 °C, (b) 55 °C, (c) 65 °C, (d) 75 °C.
After obtaining the characterization results, the biodiesel obtained is compared with SNI 7185:2015 and ASTM D6751 biodiesel. Table 4 shows that most of the biodiesel obtained from the Sonotransesterification of low grade CPO with Na2O/ANM catalysts has density, viscosity, refractive index, and free fatty acid content that meet the SNI 7182:2015 and ASTM D6751 biodiesel standards.
The catalytic performance of Na₂O/activated natural mordenite (Na₂O/ANM) in the Sonotransesterification of low grade crude palm oil was evaluated and compared with similar studies in the literature, as shown in Table 5. The highest biodiesel yield obtained in this study was 80.08% at 65 °C for 60 min using a 4 wt% catalyst loading, 1:12 methanol-to-oil molar ratio, and ultrasonic irradiation at 37 kHz. This yield is comparable to or even superior to several previous studies utilizing solid base catalysts.For instance, Martínez et al. (2014) reported a biodiesel yield of 76% using a Na₂O/NaX catalyst under conventional heating for 2 hours23. Similarly, Li et al. (2019) achieved a higher yield of 98.6% using a Li/NaY zeolite catalyst, but under more severe conditions and longer reaction time23. Compared to conventional zeolites, the Na₂O/ANM catalyst demonstrates a good balance between reaction efficiency and mild operating conditions, particularly when combined with ultrasonic irradiation.
The enhanced performance can be attributed to the increased basicity of the catalyst due to Na₂O impregnation and to the structural advantages of activated mordenite, such as improved surface area and pore accessibility. The acid activation process, which included HF and HCl treatment followed by ion exchange with NH₄Cl, significantly improved the physicochemical properties of the zeolite. This is reflected in the increased Si/Al ratio (from 6.48 to 8.9), enhanced crystallinity (as shown by XRD), and reduced metal impurities (confirmed by XRF analysis). These modifications play a critical role in improving the interaction between the Na₂O active phase and the zeolite support, thereby enhancing the basicity and catalytic performance. In comparison, Martínez et al. (2014) reported a lower biodiesel yield of 76% using a Na₂O/NaX catalyst without prior zeolite activation under conventional heating conditions22, while Li et al. (2019) achieved a higher yield of 98.6% with a Li/NaY catalyst, but under more complex synthesis conditions and longer reaction times23.
Furthermore, the application of ultrasound significantly improves mass transfer between the immiscible phases, reducing reaction time and enhancing yield, a trend similarly observed by Pukale et al.7 in ultrasound-assisted transesterification using heterogeneous catalysts7. Overall, the combination of low cost catalyst, moderate reaction conditions, and ultrasonic activation positions Na2O/ANM as a promising candidate for sustainable biodiesel production. This result demonstrates that the Na2O/ANM catalyst has promising transesterification activity under moderate reaction conditions. Compared to non-activated natural zeolites or unmodified supports used in previous studies, the acid-activated mordenite support in this work contributes to a more favorable catalytic environment.
Analysis using GC–MS showed the presence of several peaks of major components in methyl esters obtained from the sonotransesterification of low grade CPO, as shown in Fig. 11. The chromatogram shows nine peaks, which represent the compounds of methyl ester obtained. Each peak has its retention time and area, as shown in Table 6. The mass spectrum obtained at each subsequent retention time was compared to the methyl ester standard library for data similarity.
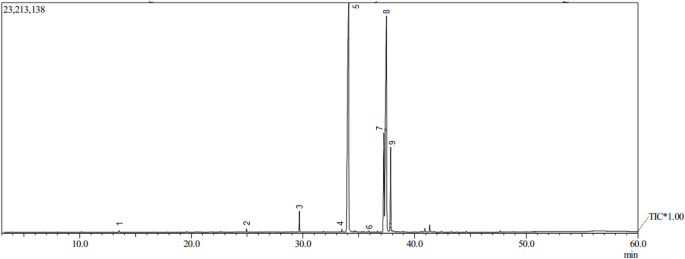
Chromatogram GC–MS methyl ester.
Determination of reaction rate and kinetic model
The kinetic analysis of the transesterification reaction was carried out using three different models: zero-order, pseudo-first-order, and pseudo-second-order kinetics. These models were chosen based on their relevance to heterogeneous catalytic systems with excess alcohol. The zero-order model assumes that the reaction rate is independent of reactant concentration, which is typically observed when the catalyst surface is saturated55. The pseudo-first-order model assumes that methanol is in large excess, making the reaction rate dependent only on triglyceride concentration25. The pseudo-second-order model considers the rate to be proportional to the square of the triglyceride concentration, representing more complex reaction kinetics or strong adsorption behaviour. The most suitable kinetic model was then determined by comparing the correlation coefficient (R2) value closest to one in the kinetics model of zero order, pseudo-first-order, and pseudo-second-order kinetics.
The transesterification reactions were performed at four different temperature ranges, from 45 °C, 55 °C, 65 °C, and 75 °C, and at different times, from 15, 30, 45, and 60 min. The concentration of triglycerides over time was used to fit the three models, and the linear regression plots for each kinetic model are shown in Fig. 12. The corresponding rate constants and correlation coefficients (R2) are summarized in Table 7.
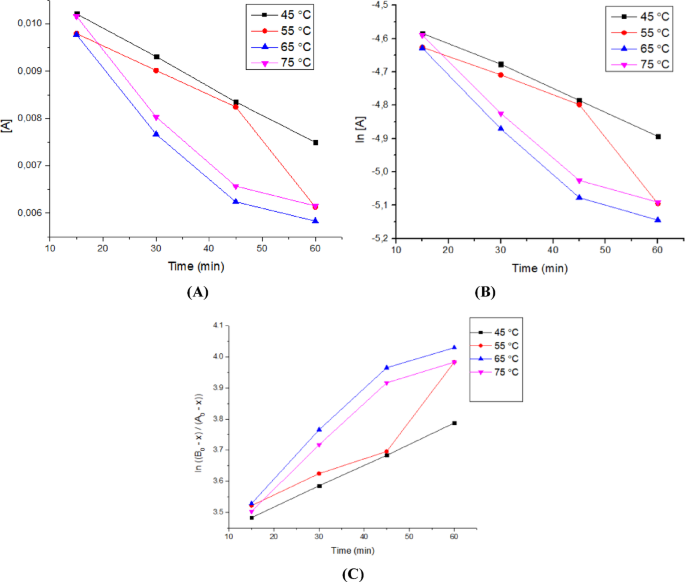
Reaction curve (A) Order 0, (B) Order 1, (C) Order 2.
Among the three models, the pseudo-second-order model yielded the highest R2 values across all temperatures, ranging from 0.893 to 0.999. Although the pseudo-second-order model yielded slightly higher correlation coefficients (R2 = 0.999) than the pseudo-first-order model (R2 = 0.998), the latter was selected as the most appropriate model. This decision is based not only on statistical fit, but also on the reaction conditions used in this study, particularly the use of excess methanol, which favours pseudo-first-order behaviour. Moreover, the pseudo-first-order model aligns with the mechanistic understanding of base-catalysed transesterification under ultrasonic irradiation, as reported in previous studies7,56. Therefore, pseudo-first-order kinetics best describe the reaction mechanism in this system.
The validity of the pseudo-first-order model was further supported by the Arrhenius plot, which showed a linear relationship between ln k vs 1/T shown in Fig. 13. The activation energy studied was limited to a temperature range of 45° to 65 °C because biodiesel yield at temperatures above 65 °C tended not to undergo significant changes. The calculated activation energy was 23.229 kJ/mol, falling within the range commonly reported for heterogeneous base catalysts (typically 20–80 kJ/mol)23,57. This also indicates that the reaction is chemically controlled and that the use of ultrasound enhances the rate without altering the fundamental kinetics, as previously reported7.
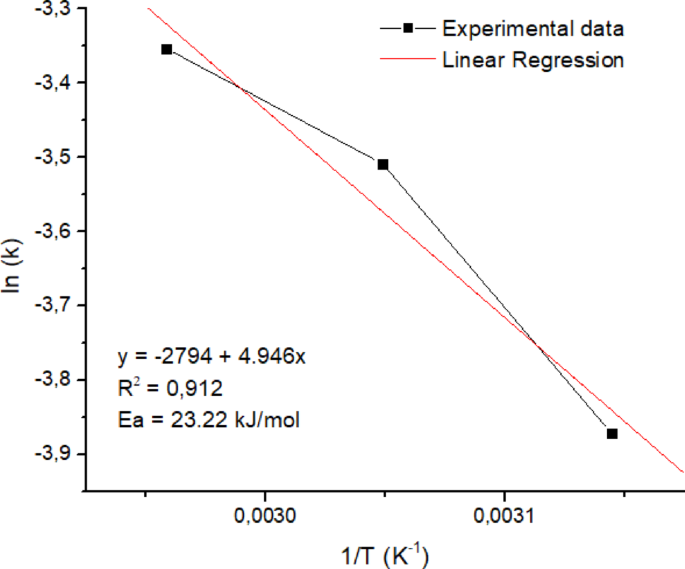
Figure 13 shows a slope of −2794 and an intercept of 4.946. The activation energy value (Ea) is calculated based on the slope value of 23.229 kJ/mol. Meanwhile, the reaction’s frequency factor (A) of 7 × 10⁻³ s–1 is calculated based on the intercept value. The activation energy value was much lower than that reported in the previous study, which was 57.37 kJ/mol in the Li/NaY catalyst23 and 78.8 kJ/mol in the CaO catalyst of the reflux method35. Thus, the rate constants of the sonotransesterification of low grade CPO using a Na2O/ANM catalyst (k) of 7 ⅹ 10–3.e(–23229/RT). Based on the model fit, rate behaviour, and theoretical justification, the transesterification reaction under ultrasonic irradiation using Na₂O/ANM catalyst follows pseudo-first-order kinetics, making this model suitable for further scale-up design and optimization. These results show that using ultrasonic-assisted Na2O/ANM catalysts in biodiesel synthesis is quite effective because it can significantly reduce the activation energy of the reaction.
Cost estimation
In this study, a low cost heterogeneous base catalyst was developed from Alpinia nigra leaves for biodiesel synthesis of low grade CPO. The calculation of the catalyst’s production cost was estimated to be $ 67/kg as shown in Table 8.