[OC] Win% trends for NFC North franchises since 1960, normalized for season length. Super Bowl wins marked with white circles.
Posted by Natural-Republic-275
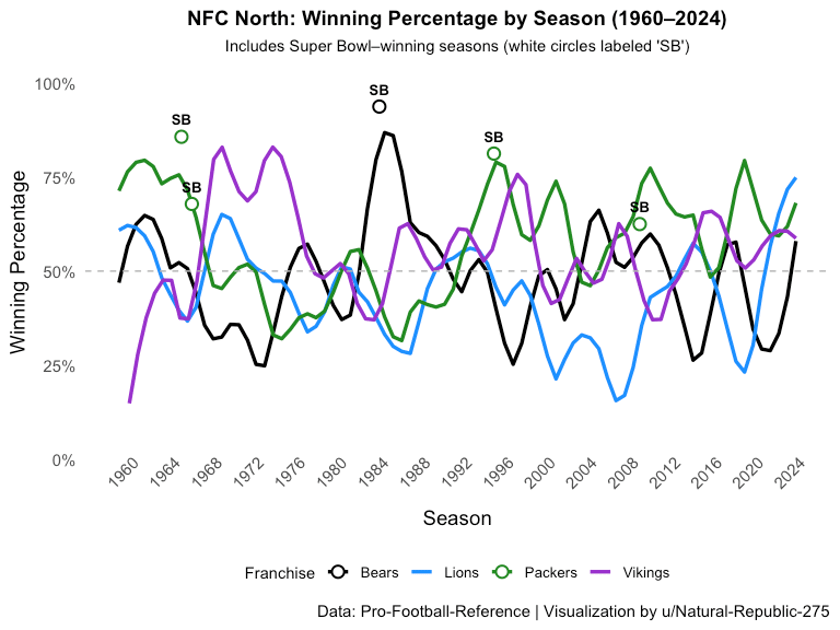
[OC] Win% trends for NFC North franchises since 1960, normalized for season length. Super Bowl wins marked with white circles.
Posted by Natural-Republic-275
5 comments
Curves are locally smoothed (LOESS, span = 0.15) to show overall trends rather than single-season volatility.
The NFC North as we know it was formed in 2002, but these franchises have been rivals for decades under earlier names like the NFC Central and Western Conference.
Source: Pro-Football-Reference (same as noted on the chart).
I’m the sports fandom equivalent of a trust fund baby. Go pack go!
All the Vikings fans scared to look at the details, concerned they’d miss the extra data point.
Why are the win percentages for the SB circles different than the win percentage for the season itself?
https://preview.redd.it/ir95282p8b0g1.png?width=840&format=png&auto=webp&s=62b24f060d3d218f39ed727e50707138f9f6db8b
Update: Improved version, based on u/Mediocre-Tonight-458 ‘s excellent feedback. The Super Bowl years are now anchored to the LOESS curves, instead of the raw data, as those points “floating” in space were disconcerting. Not wrong, as the LOESS is the smooth and the original SB circles were the actual, but this version doesn’t draw the viewer out of the moment with that discontinuity.
Thanks again!
Comments are closed.