We use Eq. (1) to examine the relationship between SCP and the business environment with the regression results presented in Table 5. In Column (1), no regional characteristic variables are controlled, and a fixed-effects model is not applied. Column (2) controls for regional characteristics while incorporating city fixed effects, but without year fixed effects. Column (3) controls for regional characteristics and simultaneously includes both city and year fixed effects. Across all specifications, the regression results consistently indicate a significant positive impact at the 10% level. This suggests that the development of smart cities effectively enhances the urban business environment, providing empirical support for Hypothesis 1.
On one hand, SCP provide assurance that market participants operate in a fair and equitable competitive environment by building digital government platforms that enable information sharing and intelligent supervision. At the same time, the extensive use of IoT-enabled big data, artificial intelligence, and blockchain technologies in smart cities not only enhances government governance capacity and efficiency34 but also establishes communication bridges between the government, enterprises, and citizens, thereby promoting government-society cooperation24. Moreover, smart cities are not limited to intelligent governance but also encompass a smart economy, smart transportation, smart living, and a smart environment. The multidimensional application of ICT improves the quality and efficiency of urban services, reduces corporate costs, and further optimizes the business environment35.
On the other hand, smart city systems drive urban technological innovation and transformation by fostering collaboration among governments, enterprises, and universities5,15, thereby enhancing urban competitiveness36. Meanwhile, intelligent resource management facilitates the rational allocation of energy, reduces energy consumption, and drives the green transformation of industries, ultimately improving the level of urban green and low-carbon development. Increased technological innovation, industrial upgrading, and optimized resource allocation enhance urban ecological efficiency, which further contributes to the optimization of the business environment3.
This study first employs a multi-period DID model with fixed effects to examine the linear relationship between SCP and the business environment. Compared to the traditional DID approach, the multi-period DID method offers greater applicability by accommodating the staggered implementation of policies over time, while effectively controlling for unobservable individual fixed effects and time trends, thereby enhancing estimation accuracy and external validity. Initially, a linear analysis based on fixed effects was conducted, and subsequently, a panel threshold regression was introduced as a supplementary test, using the logarithm of per capita regional GDP as the threshold variable. The results show that the estimated threshold value is 10.771. Column (4) of Table 5 indicates that the policy effect is insignificant when financial support is below the threshold, whereas the effect becomes significantly positive once financial support exceeds the threshold.
Robustness testParallel trend test
To ensure the validity of the DID model, this study conducts a parallel trend test to verify whether the business environments of the treatment and control cities exhibited similar time trends before being selected as smart city. Since not all SCP were launched in the same year, we focus exclusively on cities selected as pilots in 2012 to test the parallel trend assumption. By excluding cities designated as pilots in 2013 and 2014, we ensure that the treatment group remains relatively homogeneous, allowing for a more precise assessment of the parallel trend. We incorporate dummy variables representing five years before and eight years after the policy implementation into the model, using the earliest period as the baseline37. As shown in Fig. 3, prior to the launch of smart city program, the regression coefficients for the business environment remain close to zero and are statistically insignificant, indicating no meaningful difference between the treatment and control groups. However, starting from the second year after SCP implementation, the regression results become significantly positive at the 95% confidence level. This confirms that our research design passes the parallel trend test. Figure 3 and Table 6 further illustrates that from the second year onward, the business environment in treatment cities improves significantly relative to the control group, showing a divergence that continues to expand over time. This pattern aligns with the long development cycles of smart city infrastructure and technological innovation, suggesting that the policy effects exhibit a lagged response. The supplementary materials provide supplementary results of the parallel trends test under the 90% confidence interval. The results indicate that the parallel trend hypothesis is not rejected.
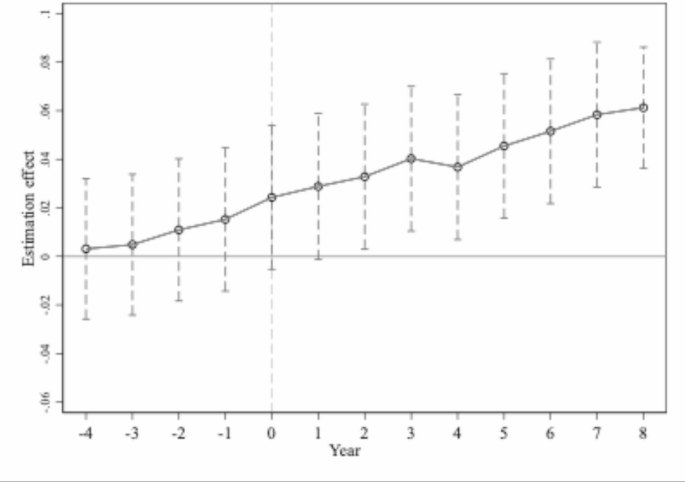
Parallel trend test. This figure shows that before SCP, there is no significant difference in the business environment between treatment and control cities. From the second year onward, the business environment in treatment cities improves significantly, with the gap widening over time.
This table reports the results of the parallel trends test along with the corresponding p-values.
Placebo test
To mitigate the potential impact of unobservable factors on the business environment, this study constructs a “placebo treatment group” by repeatedly randomizing the treatment group variable and rerunning the regression 1000 times as a placebo test. We examine the kernel density distribution of the estimated BE coefficients to determine whether the randomized estimates are centered around zero and whether they significantly deviate from the actual values. If the placebo treatment group also exhibits a significant treatment effect, it may suggest issues with sample selection or an improperly defined control group. As shown in Fig. 4, the Y-axis represents the kernel density of the estimated coefficients for the randomly generated treatment groups, while the X-axis shows the corresponding t-values. The results of the placebo test indicate that the t-values of BE coefficients follow a normal distribution, with most values falling between − 2.0 and 2.0, suggesting that the estimated BE coefficients lack statistical significance in the placebo test. Consequently, we can infer that omitted variables have a minimal impact on the estimation results, confirming the robustness of the baseline regression findings.
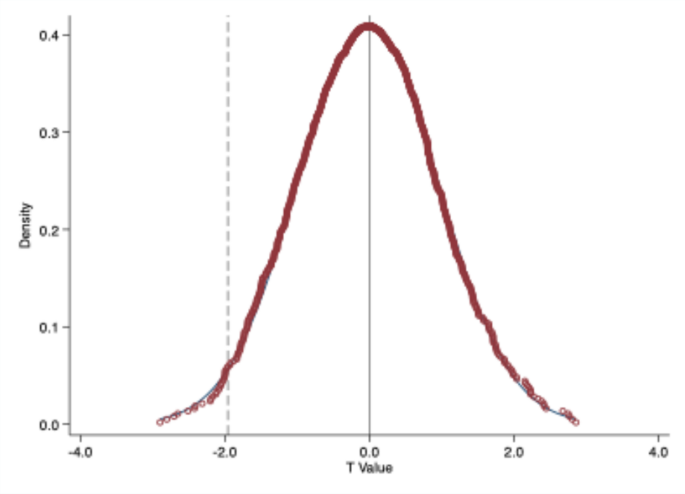
Placebo test. This figure shows the kernel density of estimated coefficients for randomly assigned treatment groups. The t-values of the BE coefficients follow a normal distribution, mostly ranging between − 2.0 and 2.0, indicating no statistical significance in the placebo test.
PSM-DID test
Our study distinguishes between the treatment and control groups based on whether a city was selected as a smart cit. However, the selection of SCP is influenced by factors such as geographic location, infrastructure development, and financial advancement, which may lead to non-random sample selection. To address this issue, we employ the PSM-DID method to re-match the samples before conducting the regression analysis. The results are presented in Table 6. We apply three different matching methods: radius matching, nearest-neighbor matching, and kernel density matching, corresponding to Columns (1) to (3) in Table 7. The regression results indicate that across all three matching methods, the estimated coefficients remain significantly positive at the 10% level. This suggests that smart city program contribute to improving the business environment. Moreover, the PSM-DID estimates are consistent with those derived from the standard DID method, reinforcing the robustness of our conclusions.
Other robustness tests
Firstly, this study considers the potential interference of the Broadband China pilot policy, which was implemented concurrently with SCP initiative during the sample period. The Ministry of Industry and Information Technology and the National Development and Reform Commission launched the Broadband China strategy in three phases in 2014, 2015, and 2016, covering 120 cities. This policy aimed to enhance local network infrastructure to support economic and social development. According to Philipp Schade38, government-led digital infrastructure development can expand market and resource access, reduce entrepreneurs’ fear of failure, and enhance the role of opportunity recognition in entrepreneurial activities. Given that industrial upgrading, green development, and digital infrastructure construction both are key channels for improving the urban business environment. The Broadband China policy may influence the estimation of BE coefficients, potentially leading to an overestimation or underestimation of the impact of SCP. Therefore, it is crucial to account for this policy’s effect in our analysis. As shown in Column (1) of Table 8, after including a dummy variable for the Broadband China policy (kdDID) in the model, the BE coefficient remains significantly positive at the 10% level. This reinforces the robustness of our findings, confirming that the estimated effect of SCP is not biased by the concurrent Broadband China initiative.
Secondly, to address sample selection bias and endogeneity issues arising from omitted variables, we follow the approach of Gong et al.39 and employ a two-stage regression model to partially mitigate endogeneity concerns. For the selection of instrumental variables, we draw from the methodologies of Lin and Tan et al.24,40, using city topographic variation as the instrumental variable. On one hand, network infrastructure is a critical component of smart city development, and topographic variation, as an essential natural condition, influences both population distribution and the cost, signal quality, and operational efficiency of network infrastructure. Therefore, city topographic variation satisfies the relevance requirement of an instrumental variable. On the other hand, topographic variation does not directly affect the business environment, fulfilling the exogeneity criterion. As shown in Column (2) of Table 8, the first-stage regression results indicate that cities with greater topographic variation are more likely to be selected as smart city pilot sites. Column (3) presents the second-stage regression results, showing that when topographic variation is used as an instrumental variable, the BE coefficient remains significantly positive, further confirming the robustness of the baseline regression results.
Finally, we apply a 1% winsorization to the control variables to mitigate the influence of outliers on the estimation results and re-estimate the baseline model. The results are presented in Column (4) of Table 8. It can be observed that the BE coefficient remains significantly positive at the 5% level, indicating that our regression results remain robust even after accounting for the impact of outliers.
HeterogeneityUrban size heterogeneity
Given that the impact of SCP on the business environment may vary depending on city size, we conduct a heterogeneity analysis based on urban scale. In 2014, China’s State Council issued a classification standard for city sizes based on permanent resident population, dividing cities into five tiers and seven categories. According to this standard, cities with a population below 1 million are classified as medium-sized cities, those with 1 to 5 million residents as large cities, those with 5 to 10 million residents as megacities, and those exceeding 10 million residents as super megacities. As of 2021, in western China, only a few cities—Wuhai (Inner Mongolia), Tongchuan (Shaanxi), Jiayuguan and Jinchang (Gansu), and Shizuishan (Ningxia)—had populations below 1 million. To ensure meaningful analysis, we set 5 million residents as the cutoff: cities with fewer than 5 million residents are classified as large cities, while those above 5 million are considered megacities. Since only three cities—Chongqing, Chengdu, and Xi’an—qualify as super megacities, we merge them into the megacity category for analysis. Table 9 presents the regression results: Column (1) reports estimate for megacities, while Column (2) shows results for large cities. The findings suggest that smart city program significantly enhance the business environment in megacities, but the effect is not evident in large cities. This is consistent with the findings of Jiang et al. and Yao et al.3,12 regarding smart cities. A possible explanation is that larger cities benefit more from economies of scale and agglomeration effects, as they already possess well-developed information resources and network infrastructure. Since advanced infrastructure is a fundamental determinant of business environment improvement, megacities are better positioned to ensure the effective implementation of SCP, leading to greater optimization of the business environment.
Urban characteristic heterogeneity
Appio36 find that the development of smart cities requires not only the support of digital infrastructure, but also the coordinated collaboration of social capital and human capital. However, each city has distinct regional characteristics, such as human capital levels, financial support, and digital infrastructure development, which may lead to varying effects of SCP on the business environment. Human capital levels help determine whether a city has sufficient reserves to support future production and innovation activities. Financial support levels reflect the government’s commitment to optimizing the business environment. The level of digital infrastructure development indicates whether a city has the necessary foundation to support smart city construction. Therefore, this study selects three regional characteristic indicators—human capital level, financial investment intensity, and digital infrastructure development—for heterogeneity analysis. Human capital level is measured as the proportion of undergraduate and associate degree students in the city’s total year-end population, with the median value used as the cutoff to distinguish between high and low human capital levels. Financial investment intensity is measured as the ratio of fixed asset investment to local public budget expenditure, with the median value also serving as the threshold for distinguishing different levels of financial support. Digital infrastructure development is measured by the number of broadband internet access users in the city, with the median value similarly used to differentiate between high and low levels of digital infrastructure.
Columns (3) and (4) of Table 9 represent city samples with low and high levels of human capital, respectively. The results indicate that in cities with high human capital, smart city pilot policies exert a significantly positive impact on the business environment. In contrast, such policies show no effect in cities with low human capital. Human capital is a key driver of urban productivity and innovation, enabling firms to more effectively absorb and utilize new knowledge41. According to Romer’s endogenous growth model42, technological progress depends not only on R&D investment, but also on the ability to disseminate and absorb knowledge. Firms must possess sufficient absorptive capacity to benefit from the widespread application of internet-based technologies41,43. The theory of human capital externalities further suggests that cities with high levels of human capital, characterized by a greater concentration of highly educated labor, are more likely to form learning organizations and innovation clusters. These cities therefore possess stronger capabilities for knowledge absorption and transformation44. As a result, cities with higher levels of human capital are better positioned to leverage SCP to optimize their business environments.
Column (1) and Column (2) of Table 10 represent city samples with low and high levels of financial support, respectively. The results suggest that smart city construction has a significantly positive effect in cities with lower financial support levels. In these regions, infrastructure and government services are relatively underdeveloped, meaning that when smart city program is introduced, technological advancements help address existing shortcomings, leading to notable improvements in the business environment. In contrast, cities with higher financial support levels already possess well-established infrastructure, making the marginal benefits of smart city construction less pronounced. The “low baseline” effect suggests that regions with weaker initial conditions experience higher marginal gains from SCP. This aligns with the findings of Monica Escaleras45, who demonstrated that the impact of fiscal decentralization on business environments is more significant in low-income countries than in high-income countries.
The last two columns of Table 10 represent city samples with low and high levels of digital infrastructure, respectively. The results indicate that in cities with a higher number of broadband internet users, SCP has a significantly positive effect, whereas in cities with lower material support levels, the same effect is not observed. Cities with better digital infrastructure are equipped with high-quality IoT infrastructure, cloud computing facilities, and geospatial infrastructure, which enhance internet penetration rates. The internet not only enhances firms’ innovation capabilities by providing access to external knowledge, but also improves internal communication, thereby strengthening their ability to absorb and apply that knowledge effectively41,46. These factors provide the necessary material foundation and accelerators for technological innovation. Both spatially and temporally, cities with stronger material support are better positioned to transition from traditional urban models to smart city frameworks, ultimately fostering a more efficient and intelligent business environment.
To further investigate the synergistic effect between fiscal support and digital infrastructure, the sample was divided into four groups based on the levels of fiscal support and digital infrastructure, and separate regressions were conducted. The results are presented in Table 11. Specifically, when both fiscal support and digital infrastructure are low (Column 1), or when fiscal support is high but digital infrastructure remains low (Column 2), the effects of smart city policies on the business environment are statistically insignificant. In contrast, when fiscal support is low but digital infrastructure is high (Column 3), the policy effect is positive and statistically significant at the 1% level. Similarly, when both fiscal support and digital infrastructure are high (Column 4), the effect is positive and significant at the 5% level. These findings suggest that high levels of digital infrastructure play a crucial role in enhancing the effectiveness of smart city policies, regardless of fiscal support levels. In regions with limited fiscal resources, improved digital infrastructure can substantially amplify the positive impact of policy interventions, thereby compensating for resource constraints.
Mechanism test
After conducting a preliminary analysis of the impact of SCP on the business environment, we further explore the transmission mechanisms between the two. In 2024, China proposed the goal of establishing a market-oriented, internationalized, and law-governed business environment. Based on this, we analyze the factors influencing the relationship between SCP and the business environment from three perspectives: marketization, internationalization, and legal institutionalization. Based on prior studies, we use the year-end balance of loans from financial institutions as a proxy for marketization47,48, the ratio of total imports and exports to regional GDP as a proxy for internationalization49,50, and the frequency of digital economy policy terms as a proxy for legal institutionalization51. We then apply Eq. (2) to conduct a mechanism test. In addition, we use the one-period lagged values of the mechanism variables as instrumental variables to address potential endogeneity between the mechanism variables and the business environment. Table 12 and Table 13 present the results of the mechanism regressions and the corresponding endogeneity tests. The results show that all mechanism regressions are significantly positive at the 1% level and successfully pass the endogeneity tests. The results indicate that smart city development optimizes the business environment by enhancing market-oriented, internationalized, and law-based institutional frameworks. These findings provide empirical support for Hypothesis 2 proposed in our theoretical analysis.
The underlying reasons for these findings can be summarized as follows: First, in cities with a higher level of financial development, the financial market is more mature, offering a greater variety of financial institutions and services. This increases the diversity and accessibility of corporate loans, thereby easing financing constraints and reducing borrowing costs for enterprises. With more available funds, businesses can invest more in innovation and research & development (R&D), which are considered key factors in improving the business environment1. Second, Digital platforms reduce transaction costs in international commerce through multiple channels while simultaneously lowering entry barriers for cross-border trade in various products. Intermediaries specializing in goods and services facilitate global connections, establish networks, and enable seamless interactions between suppliers and customers across international markets52. Third, SCP enable governments to tailor policy solutions based on local challenges, policy needs, and political conditions, leading to more effective governance53. Governments that successfully implement reforms can reduce administrative burdens and create a more favorable regulatory environment for businesses. Improvements in administrative management and tax incentives have been shown to significantly enhance the business environment54.
Additionally, this study conducts an extended test to determine whether Fintech plays a positive moderating role in the relationship between SCP and the business environment. The development of smart cities enhances Fintech by improving infrastructure, ICT technologies, and technological collaboration. At the same time, advancements in Fintech contribute to the business environment by expanding financing channels for enterprises, reducing transaction costs, increasing transparency, minimizing information asymmetry, fostering innovation and competition, and enhancing regulatory efficiency. These mechanisms help create a fairer, more transparent, and more efficient business environment, providing crucial support for the sustainable growth of enterprises.
We empirically test the moderating effect of Fintech using Eq. (3), with the results presented in Column (3) of Table 13. The findings show that the interaction term between Fintech and smart city development has a coefficient of 0.006, which is significantly positive at the 5% level. This confirms our hypothesis that Fintech indeed plays a positive moderating role in the relationship between SCP and the business environment, further supporting the validity of our analysis.
Spatial spillover effects
The previous analysis confirmed the impact of smart city development on the business environment. However, failing to account for spatial correlations between cities may introduce estimation biases. To address this issue, this study incorporates a spatial Durbin model (SDM) and constructs a geographical distance matrix to examine the effects of SCP on other cities while considering spatial proximity. This study adopts a geographic distance matrix as the spatial weight matrix. Existing research shows that technology diffusion, information transmission, and policy spillovers typically weaken with increasing distance55,56. Geographic proximity promotes resource flows, knowledge spillovers, and policy diffusion, which help improve the business environment in neighboring areas. Based on the assumption that spatial externalities diminish with distance, the geographic distance matrix is better suited to capture the spillover effects of smart city policies. To ensure robustness, this study also uses an economic distance matrix for comparison. A sensitivity analysis under different distance thresholds is provided in the supplementary materials. Based on Eqs. (7)–(9), the spatial effects for the period 2006–2021 are calculated and presented in Table 14. The analysis reveals that during this period, the Moran’s I index for the business environment, calculated using a geographical distance weight matrix, is consistently greater than zero. Additionally, the test results show that except for 2009, the p-values for all other years are below 0.1, indicating that the prerequisites for selecting and applying spatial econometric models are met.
To assess whether the spatial Durbin model (SDM) can be simplified into a spatial lag model (SLM) or a spatial error model (SEM), we conduct LM-lag, R-LM-lag, R-LM-err, LR-lag, and LR-err tests. The results represent in Table 15. This table indicates that except for the LM-lag test, which is significant at the 10% level, all other tests are significant at the 1% level. It reaffirms the presence of positive spatial autocorrelation and spatial lag effects in the business environment. Based on the results of the Hausman test, we select the spatial Durbin model (SDM) to estimate the spillover effects of smart city development.
Table 16 presents the estimated spatial spillover effects of smart city development on the business environment. Specifically, Column (1) reports the estimation results using a geographical distance matrix within the SDM framework, where the coefficient is 0.006 and statistically significant at the 5% level, indicating that smart city development generates a notable positive spillover effect. To further analyze these spatial spillover effects, we apply partial differentiation to the spatial Durbin model (SDM) and decompose the effects into total effects, direct effects, and indirect effects. The regression results, shown in Columns (2) to (4) of Table 16, indicate that the direct effect coefficient is 0.008, while the indirect effect coefficient is 0.141, both of which are significantly positive at the 1% level. Moreover, the indirect effect is greater than the direct effect, suggesting that the implementation of SCP not only improves the business environment of the target city but also enhances the business environment of geographically proximate cities. The development of digital infrastructure enhances local intelligent transportation and logistics systems while simultaneously facilitating the cross-regional flow of resources, capital, and technology. This, in turn, drives the digital transformation of surrounding areas, improves urban governance capacity, and optimizes the overall business environment.
To ensure the robustness of the results, we have conducted and included a sensitivity analysis using 900km distance thresholds in the supplementary materials. These additional analyses demonstrate the stability of our findings across different geographic thresholds, further supporting the appropriateness of using the geographic distance-based spatial weight matrix. In addition, we also conducted robustness checks using the economic distance matrix. The results remained consistent, indicating that our findings are robust to different specifications of the spatial weight matrix. The regression results based on the economic distance matrix are presented in Table 17.