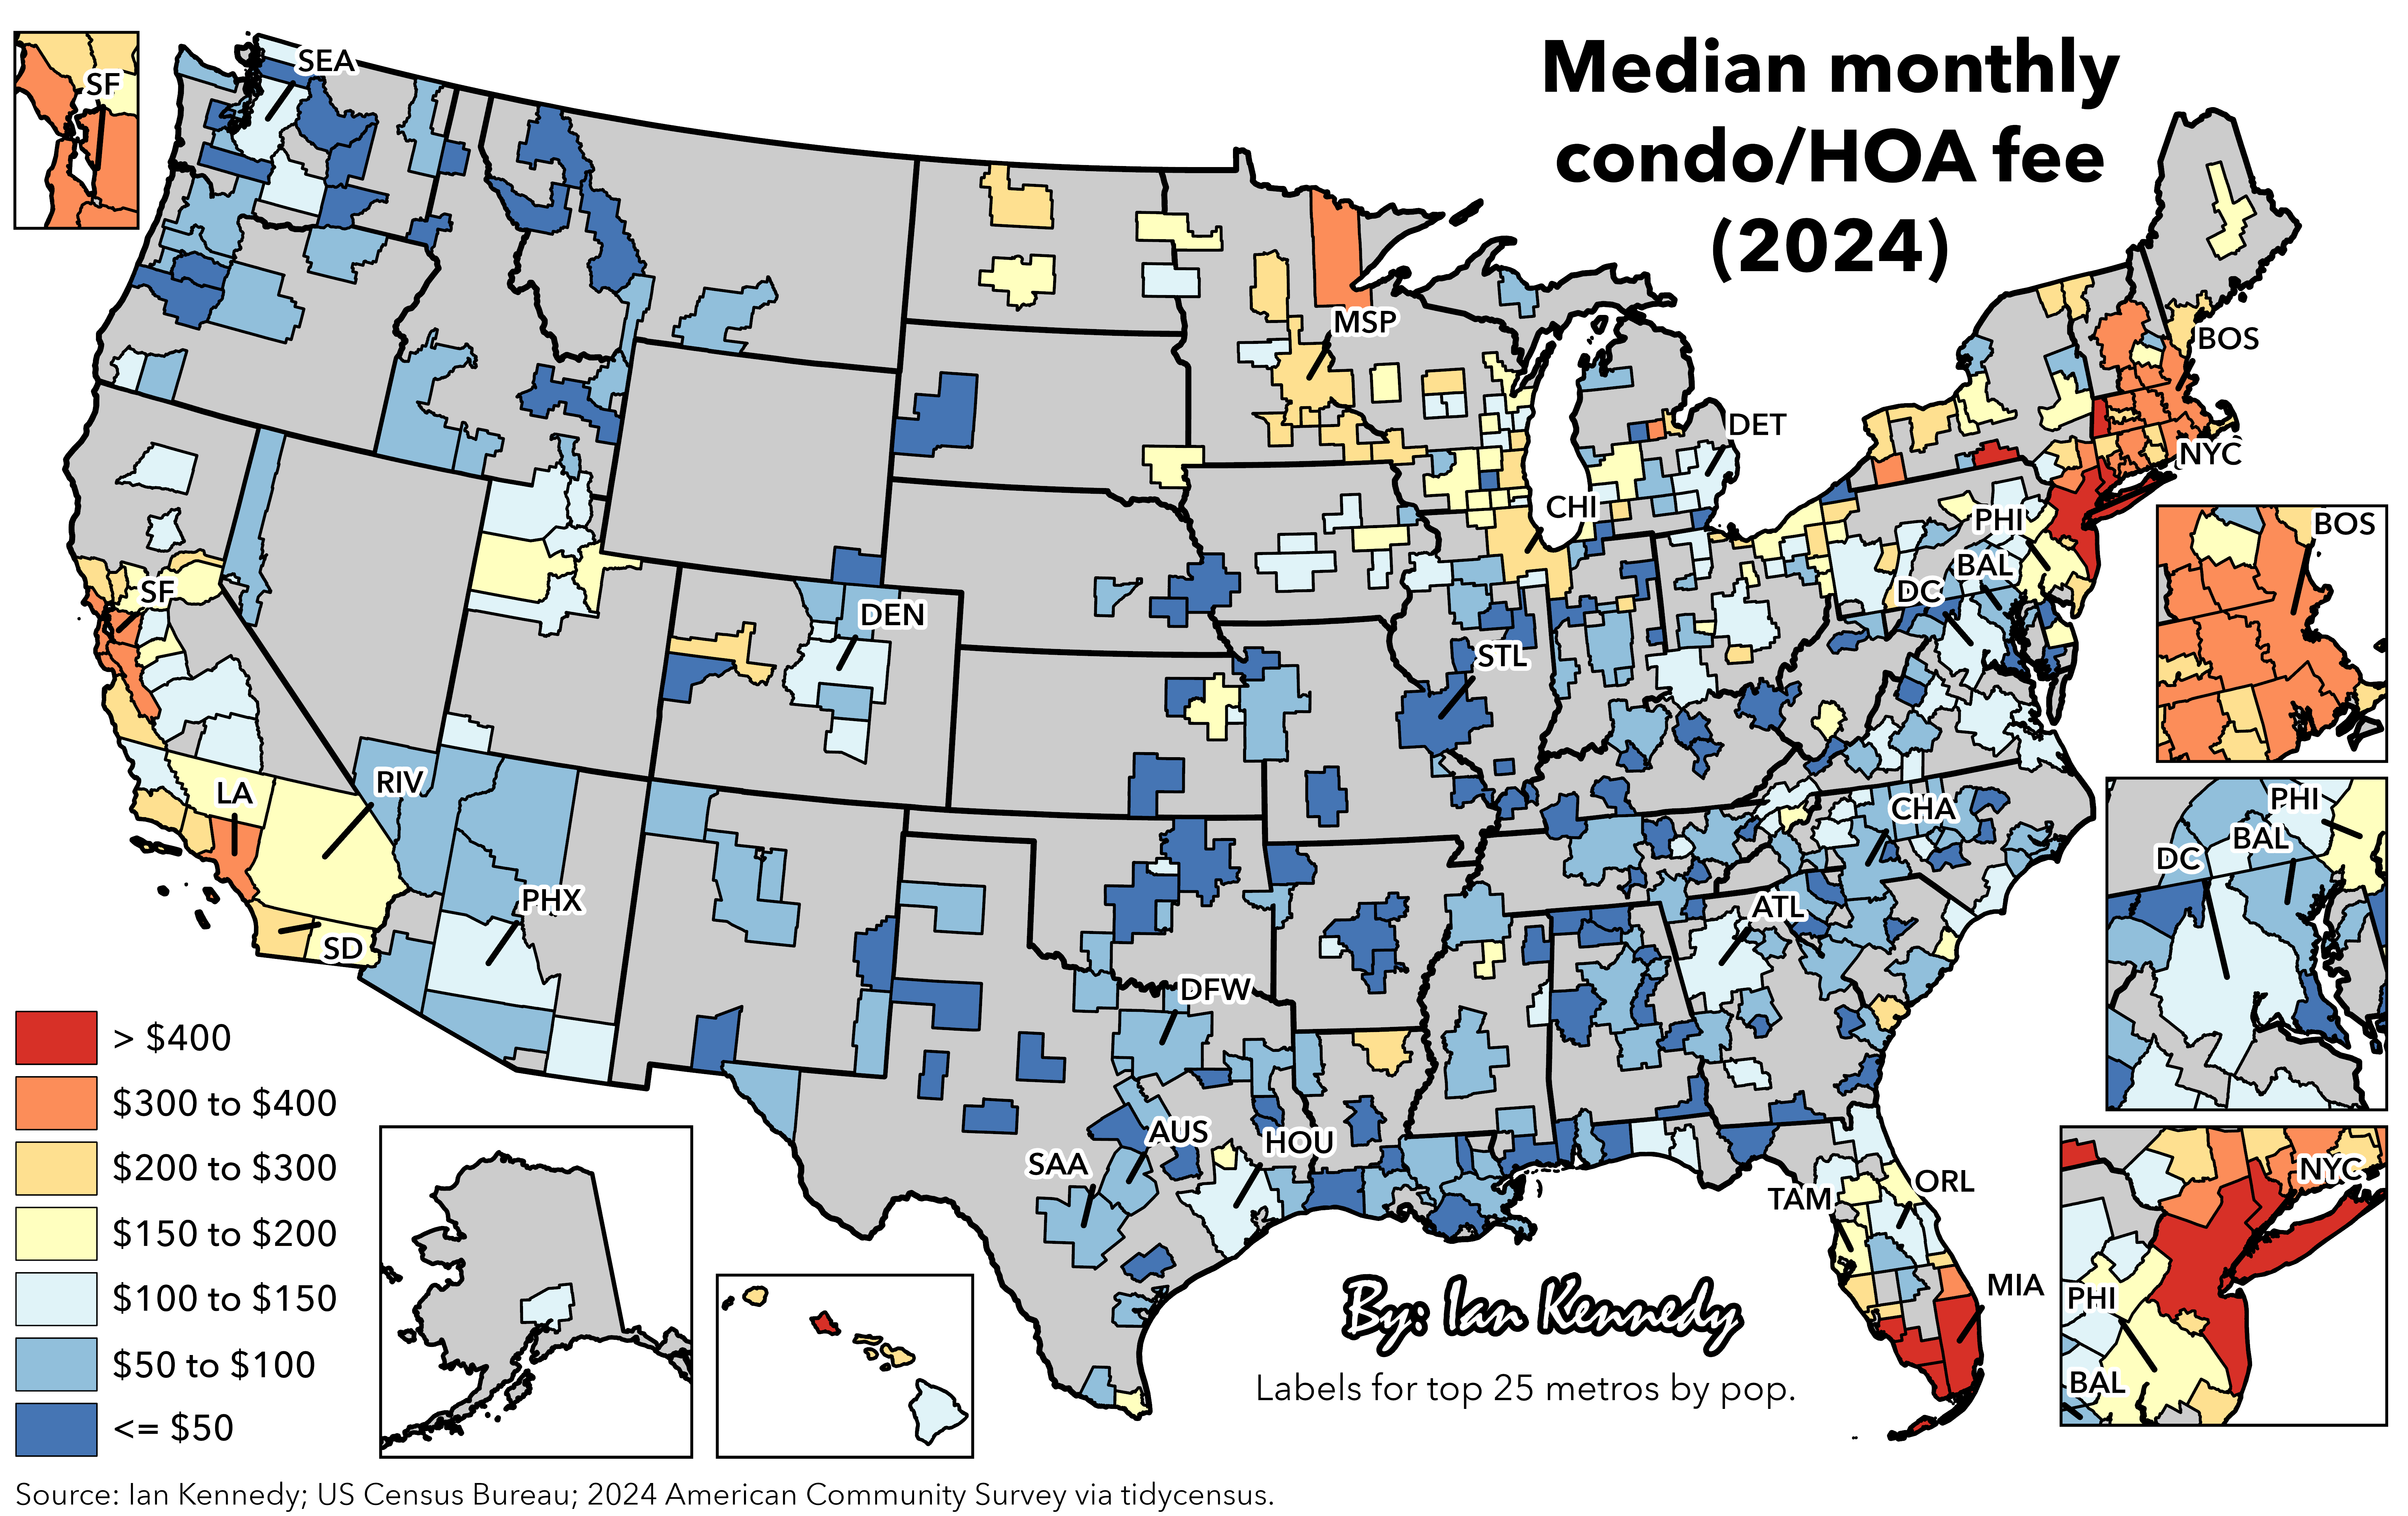
Source: 2024 American Community Survey via tidycensus.
Tools used: R and ArcGIS Pro via the R-ArcGIS Bridge.
Posted by SweetYams0
![Median monthly condo/HOA fee by metro (2024) [OC]](https://www.europesays.com/wp-content/uploads/2025/11/1wbiwn5l2u0g1-scaled.png)
Source: 2024 American Community Survey via tidycensus.
Tools used: R and ArcGIS Pro via the R-ArcGIS Bridge.
Posted by SweetYams0
8 comments
NYC has coops, which I’d imagine is partially why the fees are so high on the map.
And just more high rises where you’re paying for elevators, doormen and window washing,.
It would be very interesting to see this booked out by single family homes, townhomes/small multifamily homes, and larger multi-family homes. Condo fees are often much larger than the standard HOA fee, but they also cover wayyy more on average
As a reserve specialist, this graph encompasses too many different variables to mean much at all. Also, the vast majority of associations, especially condos, are significantly underfunded.
I suspect this could be map of median HOA age.
A lot of HOAs (especially earlier ones circa 1940-1970) locked in HOA fees behind insurmountable change requirements. My old subdivision had a $6/year HOA fee that required unanimous consent of all residents to change. It had over 1000 houses in it, so it had never been changed.
(Instead, we formed a community improvement district that could levy property taxes and transferred all maintenance costs to the CID from the HOA.)
The SF marker isn’t pointing to SF in both the main map and the cutout.
Local media, like the SF Chronicle and SJ Mercury News put average HOA fees for SF at median of about $700/mo.
I pay $40/mo in the SE. There’s a neighborhood pool, ball field, tennis courts, two playgrounds. They do well to stretch it as far as they do.
My HOA at my condo went from 250 a month two and a half years ago to 400 now.
Comments are closed.