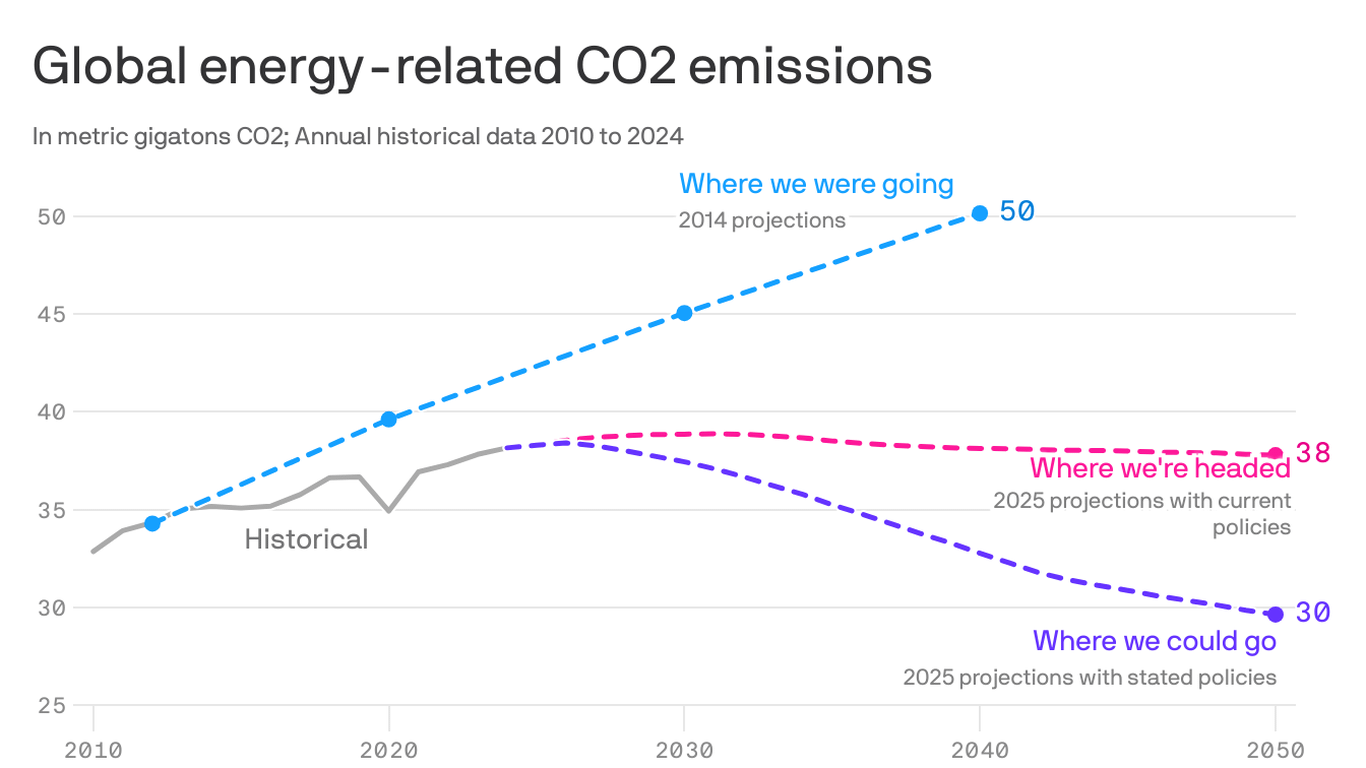
Our global progress on climate change, in one chart
https://www.axios.com/2025/11/13/climate-change-progress-chart-co2-emissions
by Naurgul
Our global progress on climate change, in one chart
https://www.axios.com/2025/11/13/climate-change-progress-chart-co2-emissions
by Naurgul
10 comments
Here is another way to look at the data: [https://ourworldindata.org/co2-emissions](https://ourworldindata.org/co2-emissions)
Peaking in the 2030s.
In 2033, we’ll see graphs showing emissions peaking in the 2040s.
A 25% drop from 2014 projections. If we did another 25% from today’s projections we’d land right at 30 coincidentally.
One can hope
So what I’m seeing is, contrary to doomers, immense progress has been made? That’s wonderful
Unfortunately, this graph doesn’t have a y-axis starting at 0. And where we need to go… is 0 new annual emissions.
So, there’s some good news in this chart. But there’s also a lot of very bad news.
I mean we’d have to reverse a lot of it at this point.
I’m sure this doesn’t account for the tipping points that we’ve recently crossed which will undoubtedly bring us past 50
Optimistic for sure.
This doesn’t look right. CO2 ppm has steadily climbed and and the rate of increase has gone up year on year.
Whatever proxy they are using needs to relate directly to actual measured co2 in the atmosphere or it’s easy to debunk.
This is a terrible representation of what is happening, and a clear and blatant attempt at greenwashing the insurmountable
Problems we face. Complete horseshit.
Comments are closed.