
TLDR
Dogecoin price dropped below $0.180 and is currently trading around $0.1619, down 0.69% in 24 hours and 10.56% over the past week
The crypto fell after large holders moved $700 million worth of DOGE, creating selling pressure across the market
Key support level sits at $0.1525, with the next support at $0.14 if that level breaks
Resistance is found at $0.1650 and $0.171, with a daily close above $0.171 potentially triggering recovery
Technical indicators show RSI at 45.99 approaching oversold levels, while the 200-day moving average stands at $0.20925
Dogecoin has entered a fresh decline, sliding below the $0.180 mark against the US dollar. The meme coin is currently trading at $0.1619.
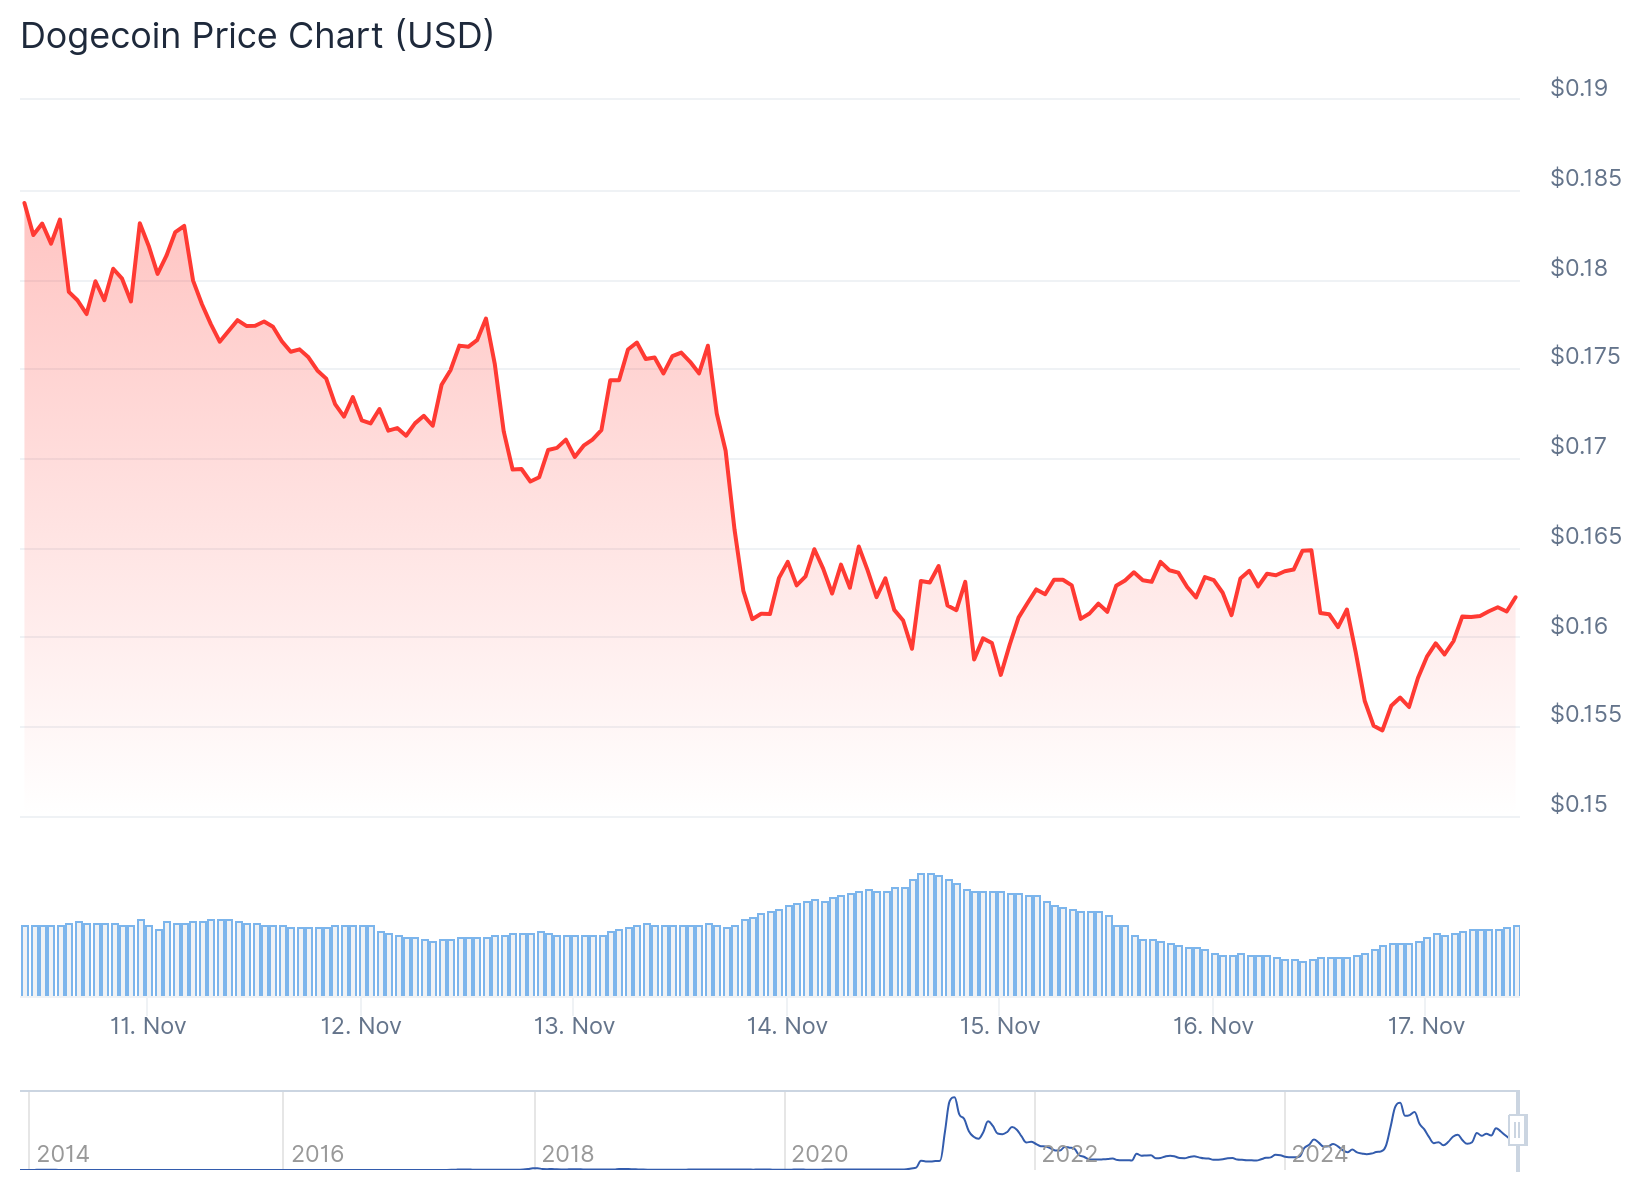
The price represents a 0.69% drop over the past 24 hours. Over the past week, DOGE has fallen 10.56%.
The recent downturn came after the crypto broke below several key support levels. DOGE first fell through $0.180, then continued lower past $0.1720.
The price reached a low near $0.1535 during the decline. Since then, the token has attempted a small recovery.
Whale Movement Sparks Selling Pressure
The sell-off intensified after large holders moved approximately $700 million worth of DOGE. This whale activity created downward pressure on the price.
4.72 billion Dogecoin $DOGE bought by whales in the last two weeks! pic.twitter.com/9XGweARtBj
— Ali (@ali_charts) November 12, 2025
The movement came as Bitcoin fell below $100,000. The broader crypto market followed with similar declines.
DOGE broke below the $0.16466 level, which served as a key technical marker. This break confirmed the bearish trend.
The crypto is now trading below its 100-hour simple moving average. A bearish trend line has formed with resistance at $0.1650.
Key Levels to Watch
The immediate resistance sits at $0.1640. The first major resistance level is at $0.1650.
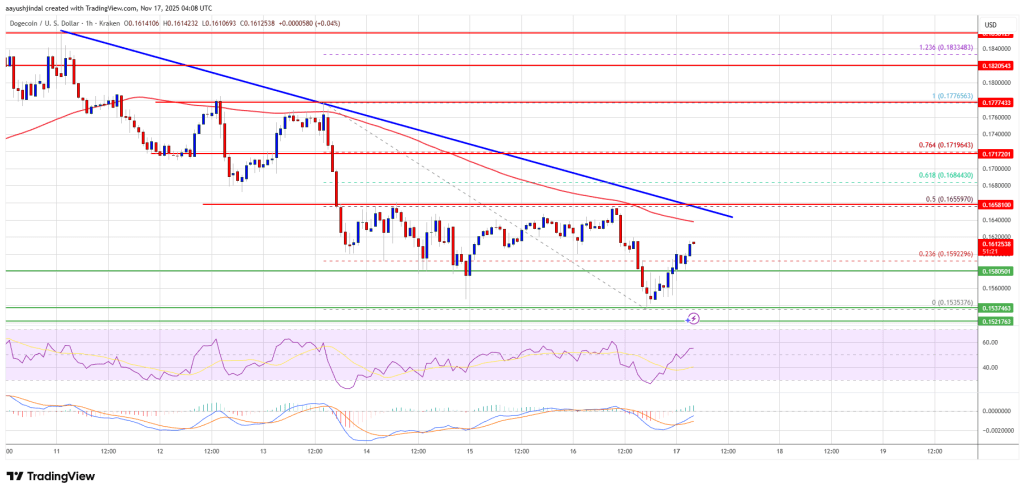 Source: TradingView
This level aligns with the 50% Fibonacci retracement from the recent swing high to low. If the price breaks above $0.1650, the next resistance is at $0.170.
A close above $0.170 could push the price toward $0.180. Further gains might target the $0.1840 level.
On the downside, support is located at $0.1550. The next major support level sits at $0.150.
The main support zone is at $0.1380. A break below this level could send the price toward $0.120 or even $0.1050.
The 200-day simple moving average stands at $0.20925. This shows how far DOGE has fallen from its medium-term trend.
The Relative Strength Index currently reads 45.99. This puts it near oversold territory but hasn’t triggered bullish signals yet.
Traders are watching the $0.171 level closely. A daily close above this point could shift momentum and trigger short-term gains.
The $0.1525 level, which matches the October low, serves as a critical support. If this level fails, the next target is $0.14.
Based on current momentum, a move to either $0.1525 or a rebound to $0.171 could happen within the next three to five trading sessions.