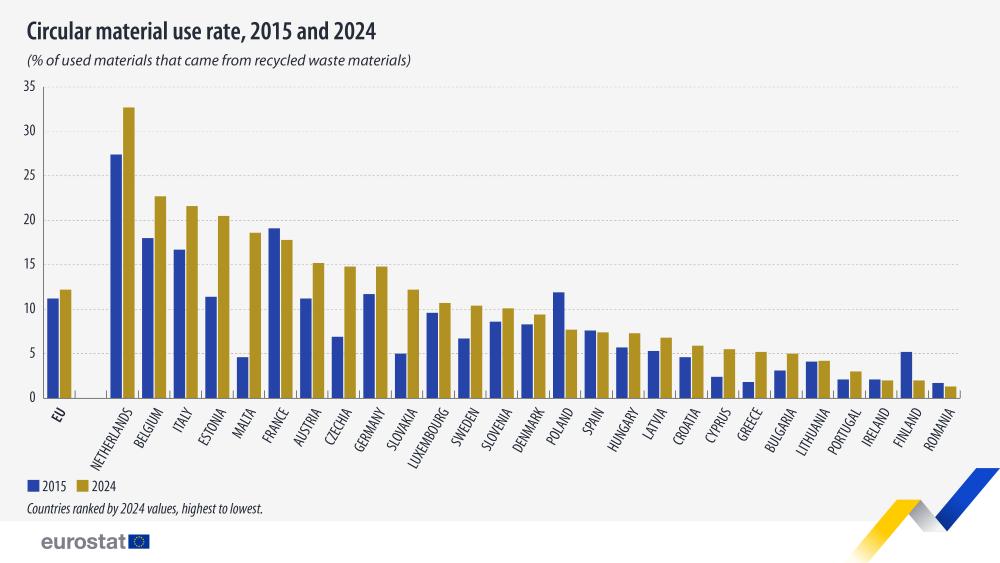
In 2024, 12.2% of materials used in the EU came from recycled materials. The indicator, known as ‘circular material use rate’ or ‘circularity rate’, measures the contribution of recycled materials in the overall use of materials.
Compared with 2023, the circularity rate increased by 0.1 percentage points (pp), however, it is the highest share on record so far. Compared with 2015, the rate is 1.0 pp higher.
This information comes from data on circular material use rate published by Eurostat today.
In 2024, the circularity rate was highest in the Netherlands (32.7%), followed by Belgium (22.7%) and Italy (21.6%). The lowest rate was recorded in Romania (1.3%), Finland and Ireland (each 2.0%) and Portugal (3.0%). Differences in the circularity rate among EU countries depend on the balance between new resources extracted from the environment and those fed back into the economy.
Source dataset: env_ac_cur
Between 2015 and 2024, the circularity rate increased in 21 EU countries. Malta (+14.0 pp), Estonia (+ 9.1 pp), Czechia (+7.9 pp), Slovakia (+7.2 pp), and the Netherlands (+5.3 pp) recorded the highest increases in the circularity rate in this period. Conversely, this rate decreased in 6 EU countries, most notably in Poland (-4.2 pp) and Finland (-3.2 pp).
When looking at the different types of materials, the EU circularity rate in 2024 was highest for metal ores with 23.4% (-1.2 pp compared with 2023), followed by non-metallic minerals with 14.3% (-0.1 pp), biomass 9.9% (+0.2 pp) and fossil energy materials/carriers with 3.8% (+0.4 pp).
The Circular economy action plan from 2020 aims to double the EU’s circular material use rate by 2030 to reach 23.2%.

