
Rapporten finns i sin helhet på denna sida men kan också hämtas som pdf-fil här.
The services sector is vital for job creation, economic growth, and resilience in Europe. It is the largest and fastest-growing part of the European economy, accounting for around 70% of the EU’s GDP and employment. The EU is also the world’s largest exporter and importer of services. Europe is a service economy.
Despite its importance, the services sector is performing well below its potential. Regulatory burdens and red tape are significantly more extensive for services than for goods. Moreover, the services sector is often overlooked in the European policy debate. Many politicians today advocate for reindustrialization, often through political means such as industrial subsidy schemes that favor the production of chips or batteries. However, this push to restore manufacturing risks coming at the expense of the services sector and may ultimately harm European competitiveness. As this report will show, no wealthy country has achieved further prosperity through reindustrialization, while all advanced economies have grown richer by embracing the servicification of their economies.
The purpose of this report is to demonstrate that the future lies in services – not in politically driven reindustrialization. Through economic analysis, EU-US comparisons, and economic simulations, we conclude that Europe stands to gain significantly by removing barriers in the services sector. Eliminating trade barriers for services could boost European GDP by 280 billion Euros over five years – equivalent to a 1.6% increase in growth.
In an increasingly uncertain world – with war on our continent and a trade war across the Atlantic – Europe must adopt an open, market-oriented policy framework that unlocks the potential of the services sector to restore competitiveness. This is not only essential for job creation and productivity but also for strengthening resilience through robust value chains. The time to act is now – Europe cannot wait.
This report has been independently written by a team at ECIPE, commissioned by Almega. The ECIPE team includes Andrea Dugo (Economist), Fredrik Erixon (Director), Oscar Guinea (Senior Economist), Dr. Philipp Lamprecht (Director and Senior Economist), and Professor Erik van der Marel (Chief Economist). The project leader on behalf of Almega was Johannes Nathell, Policy Advisor for EU and International Trade.
Almega is the largest employers’ organization in Sweden’s private services sector, representing 10,000 companies across 60 service industries and employing more than 500,000 people. The Swedish private services sector accounts for more than half of Sweden’s GDP and employs 2.5 million people. It also represents 40% of Sweden’s exports and generates four out of five new jobs.
Fredrik Östbom, Head of Policy, Almega
A ”manufacturing-first” attitude has taken hold in the European economic policy discussion. New strategies and industrial policies are designed with the ambition of boosting development and output in traditional industrial sectors. These policies often build on the assumption that industrial development and jobs are “better” than new growth and employment in the services sector – that industry is a stronger source for innovation and higher productivity growth.
This view is outdated. It is also misguided and will make Europe less competitive. A growing services sector is featured in all economies that that have matured and expanded prosperity. Over time, the services sector has grown and professionalized – and is increasingly a sector of innovation and growth in productivity. Technological change has provided new opportunities for services to fuel the entire economy with business dynamism and, of course, to improve the performance of industrial companies. Some of the most R&D intensive sectors in the economy are services: global R&D spending has certainly moved towards services. As a result, the services share of value added in modern economies is rapidly increasing.
Equally important, the “manufacturing-first” attitude prevents Europe for pursuing reforms that are necessary for the EU services sector to develop. It has been pointed out in several high-level reports – including Mario Draghi’s report on The Future of European Competitiveness – that Europe trails the US in services sector performance. Because of high and restrictive regulations, innovative services sectors have grown a lot slower in the EU than in the US. Europe’s industrial performance is better than in the US: for instance, EU industrial sector R&D is higher than in the US, when measured as share of Gross Domestic Product. Europe’s big economic challenge is to boost the services sector.
For Europe to close the gap with the US, it needs to release the competitive energy of the services sector and incentivize more R&D, innovation, and business dynamism in high value- added services sectors like ICT and scientific research. In the paper, we model a scenario in which the EU would be more like the US as far as the services sector is concerned. It would include a remarkable growth in R&D spending. For example, R&D spending on computer programming would rise from EUR 15 to 66 billion – and in services like scientific and research development it would boost R&D by eight times.
If the services sector would be thriving more, the European economy would get a serious boost. Different scenarios for a better-performing services sector are modelled in this study. Using cautious assumptions for a new development of the services sector, we find that the EU could add another 280 billion EUR to its Gross Domestic Product over five years – which equals a 1.6 percent growth.
There are several reasons why the European services sector trails the US. Digitalization and technological change are part of the explanation. Generally, US services companies have faced fewer regulations and restrictions when developing new technologies and services that fuse with “older” services and help industries to improve their performance. Boosting the European services sector requires more business and market dynamism – and a regulatory environment that primes service companies for faster growth.
Over the past decades, the global economy has undergone a profound transformation, characterised by the rise of services. Services now account for a substantial share of economic activity in both developed and developing countries, contributing significantly to global Gross Domestic Product (GDP), employment, and international trade. Currently, the services sector contributes more than half of national GDP in two thirds of all countries worldwide – up from 55 percent in 2000 and 32 percent in 1990. In short, the global economy is increasingly shifting towards services.1
In high-income countries, services now account for up to 70 percent of GDP and over 74 percent of employment.2 While the growing importance of services is particularly pronounced in developed economies, less developed countries are also experiencing the servicification of their economies. Middle-income countries show an average services share of around 50 percent of GDP and 45 percent of employment, and both figures have been steadily increasing over time. Moreover, as the global economy becomes more service-oriented, countries are transitioning into services earlier in their development paths than in the past.3
A closer look at the data reveals a clear positive relationship between the size of the service sector and a country’s level of development, leaving little room for alternative interpretations. Put simply, the larger a country’s service sector, the wealthier it tends to be.4 This pattern holds not only across countries globally but also within groups of developed economies. A recent article in The Economist asked, “Will services make the world rich?” The answer is clear: they already have.5
Services, however, are far from being a residual sector that merely expands as countries grow wealthier. On the contrary, major service industries – particularly those that are knowledge- intensive and technology-driven – have the same pro-growth characteristics that for long have been attributed to manufacturing. In particular, information and communication services, finance and insurance, and business, scientific, and technical services drive productivity, create high-value employment, and stimulate innovation across the broader economy. These „global innovators,“ as they are sometimes called, are also intensive users of human capital and prolific generators of new ideas. This was already evident over two decades ago – and it is even more so today.6
Nevertheless, the service sector continues to suffer from persistently poor public perception, particularly among politicians, and especially when contrasted with manufacturing. The “manufacturing first” narrative has increasingly permeated public discourse, notably in the rhetoric of Western leaders. The most prominent example of this is certainly US President Donald Trump, who claims he wants to make the US into “manufacturing superpower”.7
This celebratory view of manufacturing is also widespread in Europe. Even though in Europe manufacturing still represents a larger share of the economy than in the US, such manufacturing outlook often neglects, if not outright diminishing, the role of the service sector. In his “Europe Speech” of April last year, French President Emmanuel Macron proposed a new prosperity pact aimed at regaining the EU’s lost competitiveness. He asserted that European countries “must produce more and green, and decarbonized production is an opportunity for us to reindustrialize and maintain our industries in Europe.” He continued that “A precondition of this prosperity pact is to speed up on industrial policy. […] Industrial policy is providing the answer. It is the opportunity to produce everywhere in the EU.”8 This narrative focuses on more production, but not on more services.
Similarly, when unveiling the Clean Industrial Deal in February this year, European Commission President Ursula von der Leyen declared that “Europe is […] a continent of industrial production.”9 Even the Draghi Report – now arguably regarded as the new bible of EU policymaking – places at the very top of the Union’s priorities the imperative to “accelerate its rate of innovation both to maintain its manufacturing leadership and to develop new breakthrough technologies.” Says Draghi: “A window has opened for Europe to redress its failings in innovation and productivity and to restore its manufacturing potential.”10 Renewed competitiveness is to come first and foremost from manufacturing.
This fixation on manufacturing is also evident in policy choices. Despite the increasing significance of the service sector across virtually all global economies, industrial policy in many countries continues to prioritise manufacturing, often to the detriment of services. This “manufacturing first” mindset is embedded in numerous policy instruments, including targets, subsidies, and regulations that systematically favour the manufacturing sector.
A prominent example of manufacturing-biased policymaking in the US was the focus of industrial policy under the Biden administration. Analyses indicate that 83.2 per cent of counties receiving new private investment – stimulated by federal spending through the Infrastructure Investment and Jobs Act, the CHIPS and Science Act, and the Inflation Reduction Act – have experienced a decline in their manufacturing sectors since 2001.11 The quasi-totality of industrial policy spending under President Biden went to communities that lost manufacturing jobs, essentially to replace those jobs with other manufacturing ones.
This manufacturing-focused approach is also the prevailing policy trend in the EU. An analysis of State Aid data from the period 2016–2019 reveals that 67 per cent of all EU state aid was allocated to firms in industrial sectors, including manufacturing, while just over 30 per cent supported service-sector enterprises. The remaining portion was directed towards agriculture.12
The aim of this paper is precisely to challenge the enduring myth that manufacturing is inherently superior and more politically desirable to support with public policies than services. It seeks to provide a comprehensive analysis of the role of the service sector in the modern economy, particularly in the EU and the US. It’s a sobering observation that no wealthy country has achieved further prosperity through reindustrialisation; by contrast, virtually all advanced economies have grown richer by embracing the service revolution. This report outlines in detail the strong rationale for countries to do so.
The remainder of this report is as follows. Chapter 2 will challenge the notion that manufacturing alone is indispensable to national prosperity by demonstrating the growing importance of the service sector in driving economic growth, including labour productivity, firm dynamics, wages, value-added, R&D and innovation, and trade. It will also identify the key forces reshaping the service economy, such as digital technologies.
Chapter 3 will compare productivity trends in the service sectors between the EU and the US on similarly productivity, value-added, and trade. It therefore positions this comparison as a central factor in explaining the broader performance gap between the two regions, which is particularly related to innovation. The core argument is that Europe’s lag in service-sector performance is a primary contributor to the widening transatlantic productivity divide.
Chapter 4 builds on this comparison by exploring how the European economy could evolve with a more dynamic and competitive service sector. In order to strengthen the case, this chapter will go beyond broad trends and include detailed calculations and estimates that illustrate the potential economic impact of a thriving services sector. These figures will offer a tangible picture of what Europe stands to gain by adopting a service-oriented growth model.
Finally, Chapter 5 will propose a new approach to industrial policy – one that places services front and centre of a European growth strategy. This concluding chapter will present our policy recommendations and outlines the key components of an effective growth policy for services and will also discuss how it should differ from the EU’s current manufacturing-centric industrial policy.
2.1 Productivity, market dynamism, and wages
The prevailing political discourse often portrays the manufacturing sector as the sole driver of sustained economic growth. The services sector is frequently dismissed as a homogeneous collection of low productivity activities that only makes small contributions to the economy, let alone long-run economic growth. This perception is deeply flawed. In the first place, the service sector is far from monolithic; just like the manufacturing sector it includes a diverse array of economic activities with significant variations in productivity levels. In fact, several service activities such as information and communication services, finance and insurance, and business, scientific, and technical services, which are all knowledge-intensive and technology-driven, rival or even surpass productivity levels observed in manufacturing.13 These sectors together are often called the “global innovators”.
Figure 1 below presents a comparison of average labour productivity growth in the services and manufacturing sectors relative to 2015. Real labour productivity is measured as inflation-adjusted value added per hour worked and proxies sectoral efficiency stemming from the resources used such as labor. The issue of productivity is central here. Enhancing competitiveness fundamentally requires improvements in productivity: higher productivity enables businesses to produce more efficiently and compete more effectively on the global stage.14 Therefore, at the core of Europe’s competitiveness challenge is its productivity performance.
Since 2015, labour productivity growth in information and communication (ICT) services has outpaced that of the manufacturing sector. On average, value added per hour worked increased by 1.9 per cent in the information and communication services sector, compared to 1.6 percent in manufacturing. Labour productivity in professional, scientific, and technical services first declined on average by 0.8 per cent between 2007 and 2015, before rebounding to an average annual growth rate of 1.41 per cent between 2015 and 2023. Both types of sectors are important knowledge-intensive domains and therefore exhibit higher productivity levels. In contrast, the wholesale and retail, transportation, and accommodation and food service sectors have exhibited slower labour productivity growth than manufacturing since 2015, averaging just 0.7 percent per year.
FIGURE 1: REAL LABOUR PRODUCTIVITY GROWTH BY SECTOR IN THE EU-27, 2007–2023 (INDEX, 2015 = 100)
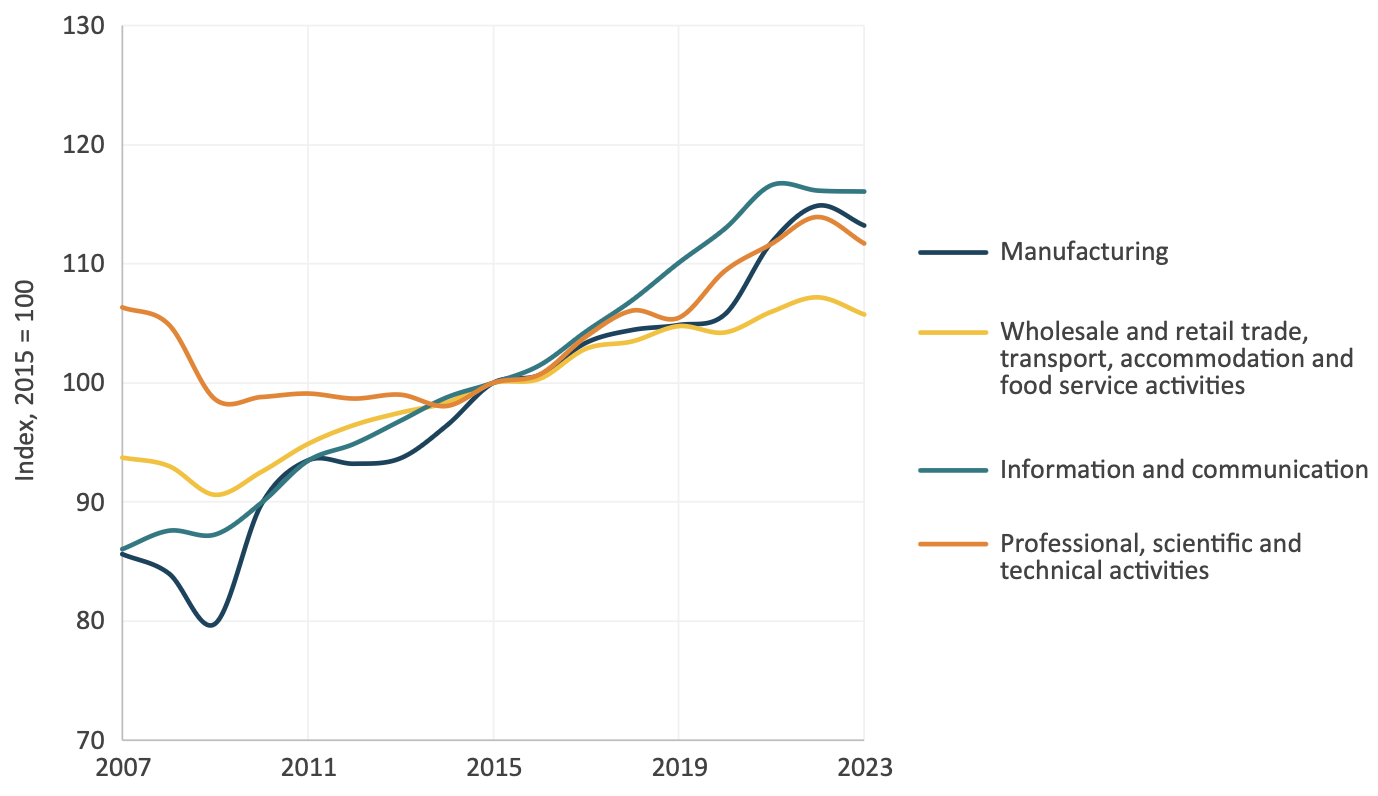 Source: ECIPE elaboration based on Eurostat.
As illustrated in Figure 2a, this combined group of service sectors contributes a significant 18.7 percent of total value added in the economy. Its comparatively weaker productivity performance is largely attributable to the limited scope for technological transformation in service delivery. These services seem less susceptible to digital penetration. A private bus company today operates in much the same way it did a decade ago, still relying on drivers to deliver the service despite likely improvements in service quality over time. Even though some sectors have improved their productivity performance thanks to some new technologies such as ride-sharing platforms, they still have lower levels compared to many global innovators. They also show lower levels of human capital intensity.
Misconceptions about service-sector jobs extend far beyond productivity. Contrary to popular belief, service sectors such as ICT, business, scientific and technical services in Europe also exhibit higher growth rates, higher salaries, and greater levels of creative destruction than other parts of the economy. Moreover, these sectors are playing an increasingly central role in the EU’s economy. As shown in Figure 2a, the value added generated by global innovators combined is nearly equal to that of manufacturing, while the combined value added of retail trade, transportation, accommodation, and food services exceeds that of manufacturing.
FIGURES 2A AND 2B: GROSS VALUE ADDED (GVA) BY SECTOR IN THE EU-27
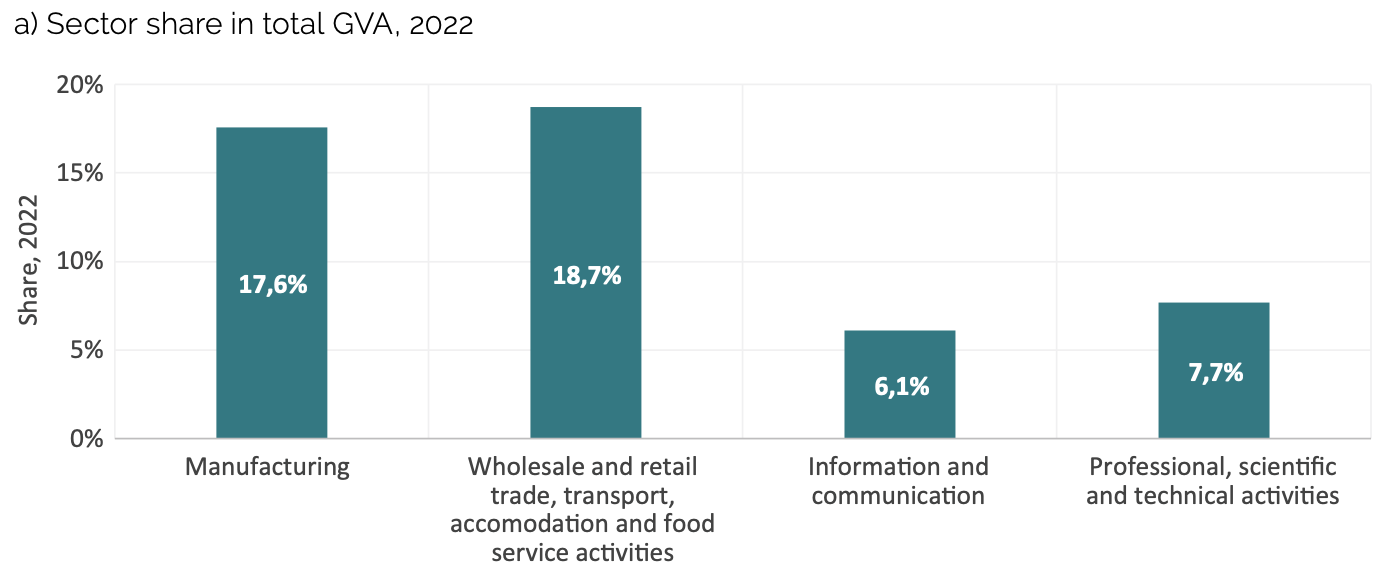
 Source: ECIPE calculations based on Eurostat. Note: Gross value added in chain linked volumes (2015).
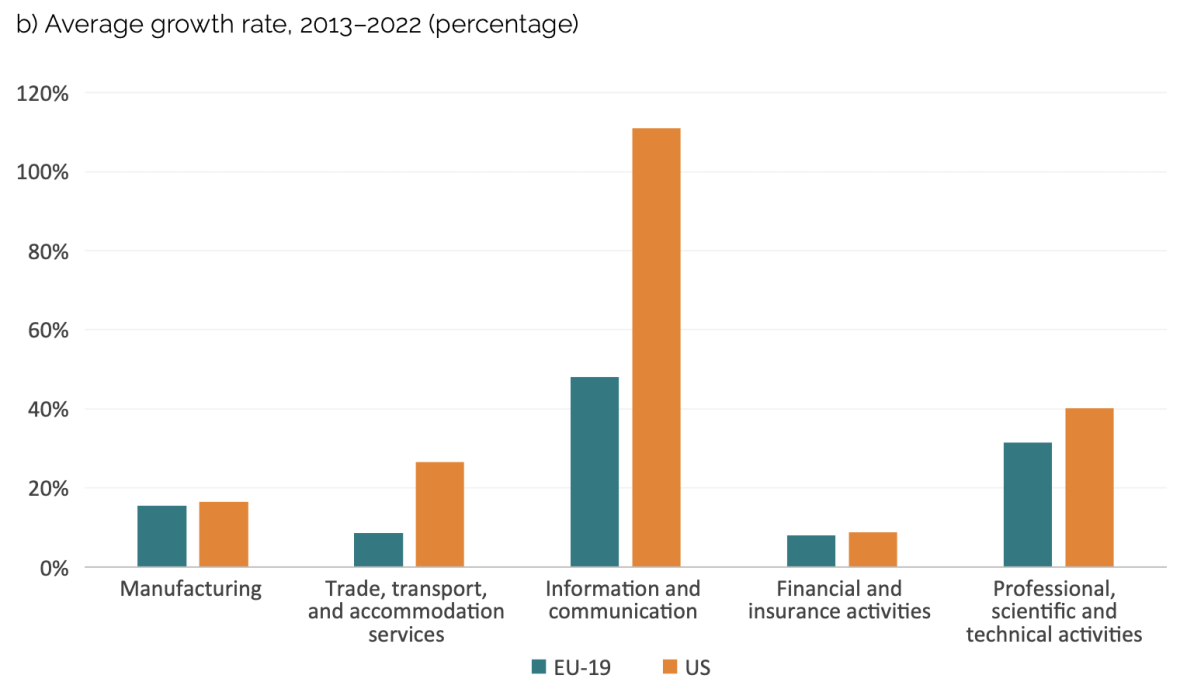
In terms of growth rates, Figure 2b illustrates that global innovators have on average expanded more rapidly than both manufacturing and other services in the EU between 2013- 2022, signalling their dynamism. Specifically, real gross value added in the information and communication services sector grew at an average annual rate of 5.36 percent, followed by 3.58 percent in professional and scientific services. By contrast, the manufacturing sector recorded a more modest average growth rate of 2.41 percent over the same period.
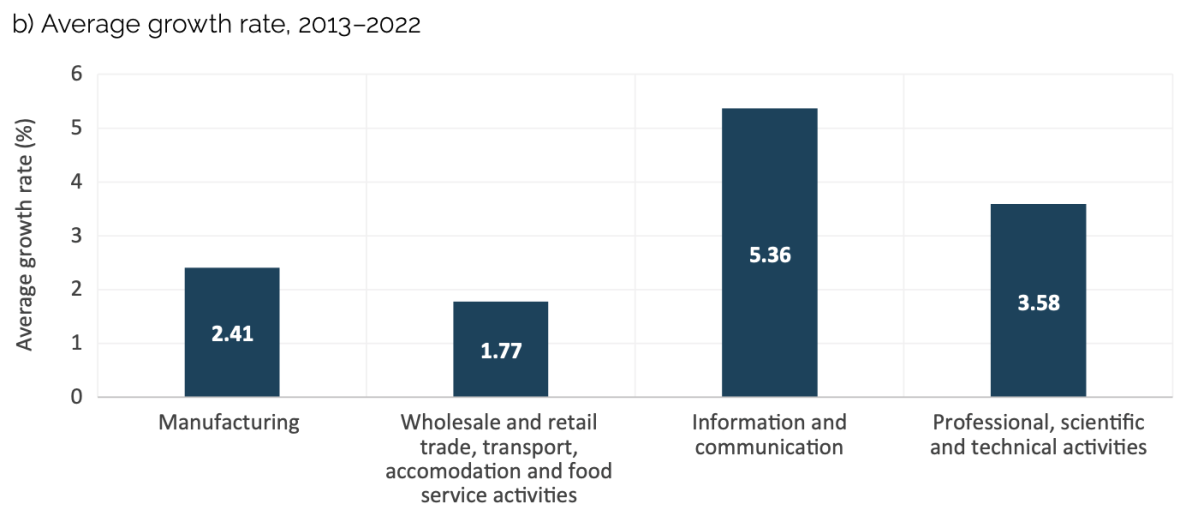
Another key indicator of economic development is the level of creative destruction, or more technically, business dynamism, which measures the market’s capacity to reallocate capital and labour from less to more productive firms. To measure this dynamism, a useful proxy is the churn rate of a sector, which is defined as the combined rate of firm entry (birth rate) and exit (death rate). The processes of business creation and closure are vital, as they reflect the mechanism of creative destruction, through which inefficient firms are replaced by newer, more productive entrants. This dynamic is a crucial driver of productivity growth. In well-functioning markets, resources such as labour and capital are reallocated away from underperforming firms and towards those that are more efficient.15
Figure 3 illustrates the average business dynamism across industry and services in the EU between 2012-2022, measured as a proportion of active enterprises. Revealingly, the figure shows that business dynamism in all services sectors in Europe is higher than manufacturing. In information and communication services this rate has been notably high with an average of 20.4 percent, followed by professional, scientific and technical services with 17.5 percent, then the trade, transport, and hospitality sector with 16.9 percent. The manufacturing sectors shows a rate of only 13.6 percent. Moreover, the number of businesses in a sector tends to grow over time when the birth rate exceeds the death rate, which is an effect clearly seen in both the ICT and professional services sectors. In contrast, the manufacturing sector experienced only a modest increase in business activity.
FIGURE 3: AVERAGE BUSINESS DYNAMISM BY SECTOR IN THE EU, 2013–2022 (PERCENTAGE)
 Source: ECIPE calculations based on Eurostat.
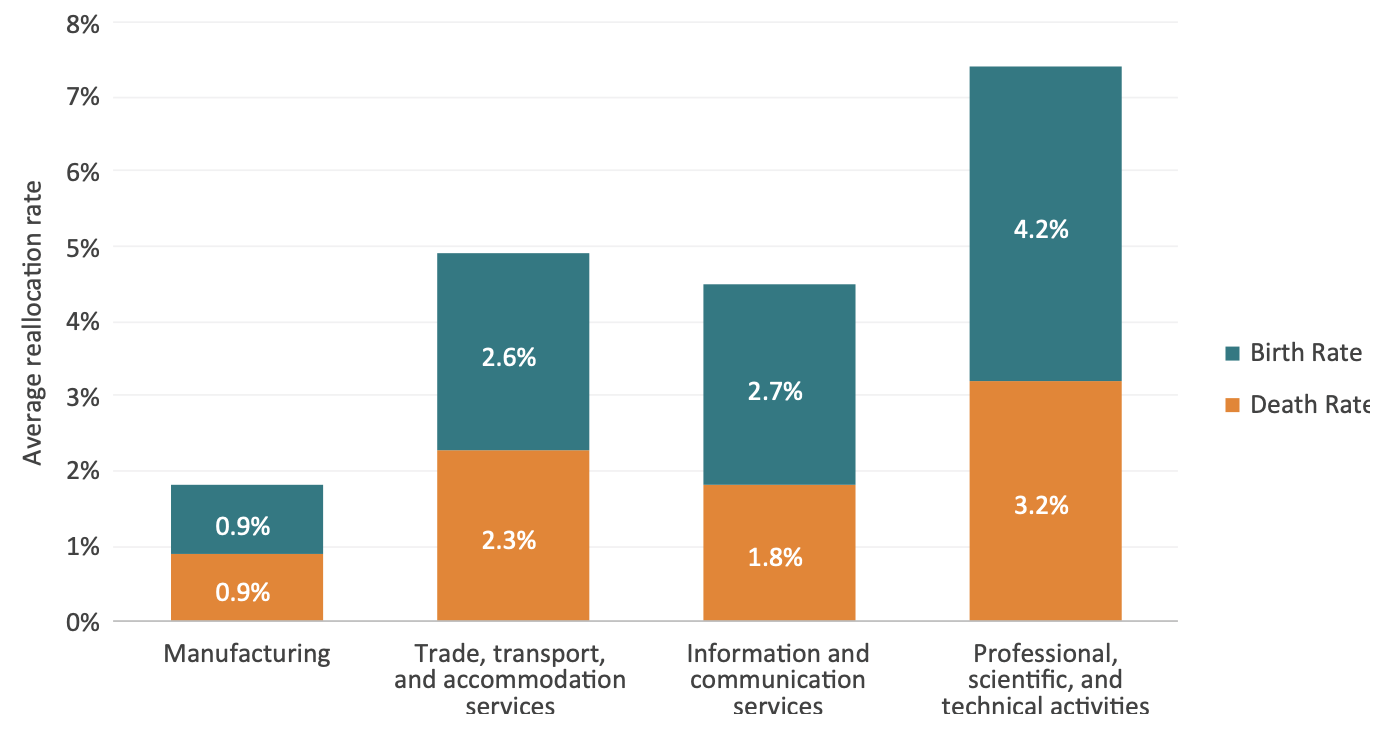
Figure 4 presents a similar analysis, focusing on employment dynamism linked to firm entry and exit. The employment birth (or death) rate measures the number of employees in newly established (or exiting) enterprises as a proportion of total employment in the sector. More technically, it captures changes in employment reallocation rather than firm dynamics. The figure shows that services exhibit a higher employment dynamism than manufacturing. Professional, scientific, and technical services have the highest labour market dynamism at 7.4 percent, followed by trade, transportation and hospitality services at 4.9 percent and information and communication services at 4.5 percent. In contrast, manufacturing lags significantly behind at just 1.8 percent, indicating relative stagnation in workforce turnover.
In general, a higher rate of employment reallocation suggests greater economic efficiency, as less productive firms exiting the market release labour that can be absorbed by more dynamic, newly established enterprises. The entry of new, fast-growing firms is not only vital for economic growth, but also plays a pivotal role in job creation. Extensive evidence from dozens of countries shows that young firms are consistent drivers of employment, while older firms are more likely to shed jobs. Indeed, young firms tend to be net job creators across the business cycle – even during periods of economic downturn.16
FIGURE 4: AVERAGE EMPLOYMENT DYNAMISM BY SECTOR IN THE EU, 2013–2022 (PERCENTAGE)
 Source: ECIPE calculations based on Eurostat.
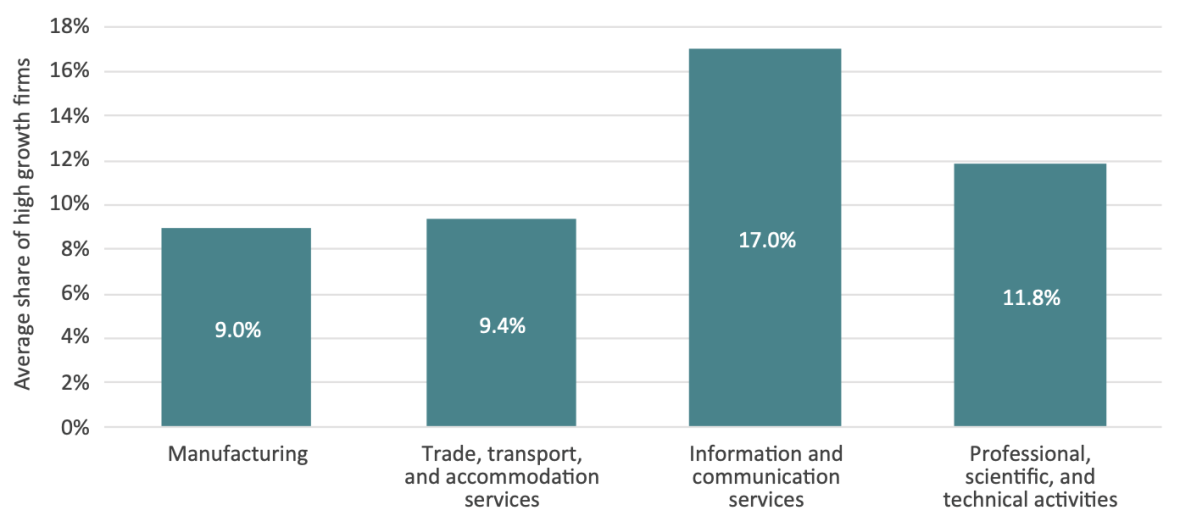
As a result, the greater level of firm and employment dynamism in services also translates into a higher proportion of high-growth firms, which can be seen in Figure 5. Young, high-growth firms are especially important in the economy, as they consistently achieve greater returns on R&D, thereby driving innovation, accelerating technological adoption, and contributing more broadly to productivity gains and economic growth in the long-run. Measured by employment growth exceeding 10 percent annually, high-growth firms in information and communication services accounted for an average of 17 percent of all firms between 2014-2022, followed by professional, scientific, and technical services of almost 12 percent, then trade and transport services of 9.4 percent. Manufacturing shows the lowest share of 9 percent.
FIGURE 5: AVERAGE NUMBER OF HIGH-GROWTH FIRMS AS A SHARE OF TOTAL BY SECTOR IN THE EU, 2014–2022 (PERCENTAGE)
 Source: ECIPE calculations based on Eurostat. Note: High growth firms are measured in employment (growth by 10% or more).
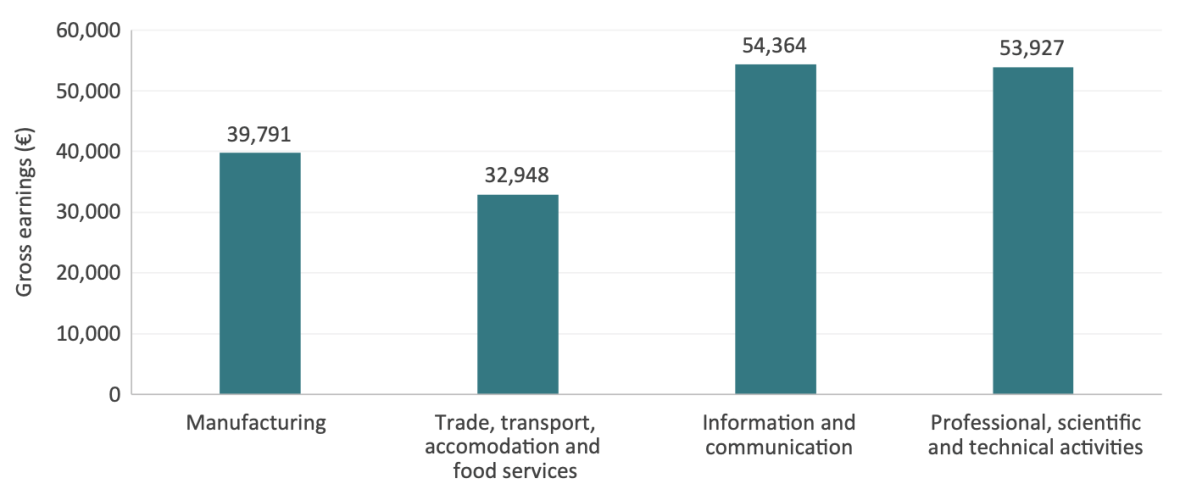
Beyond productivity, growth rates, and business dynamism, another myth to dispel is the notion that manufacturing jobs inherently offer better wages than service activities. Figure 6 illustrates that average earnings are higher in the global innovators compared to both the manufacturing sector and trade, transport and accommodation services. Specifically, gross earnings, which encompass wages and salaries paid to employees before tax and deductions, are significantly higher in information and communication services than in manufacturing. The earnings gap between professional services and manufacturing also substantial. This wage disparity partly reflects the higher labour productivity observed in these sectors over the past decade.
FIGURE 6: AVERAGE GROSS EARNINGS PER EMPLOYEE BY SECTOR IN THE EU-27, 2022 (EUROS)
 Source: ECIPE elaboration based on Eurostat. Note: Due to data availability, the figure relates to firms with 10 employees or more.
2.2 Investment in ICT, R&D and intangible capital
With this macroeconomic context established, it is crucial to examine several key factors that drive change in the services sector – factors typically linked to investments known to boost productivity. These investments are particularly related to digital technologies, R&D and innovation, and the effective use of intangible capital.
The degree to which ICT and digital technologies are adopted offers a valuable indicator of growth potential across the economy as they drive up productivity in sectors. Investment in digital infrastructure is essential for two main reasons. First, it facilitates productivity gains through the diffusion of existing ICT technologies. Second, it lays the groundwork for future productivity growth driven by the next wave of innovation in intangible assets, such as general-purpose technologies like Artificial Intelligence (AI) and quantum technologies (QT).
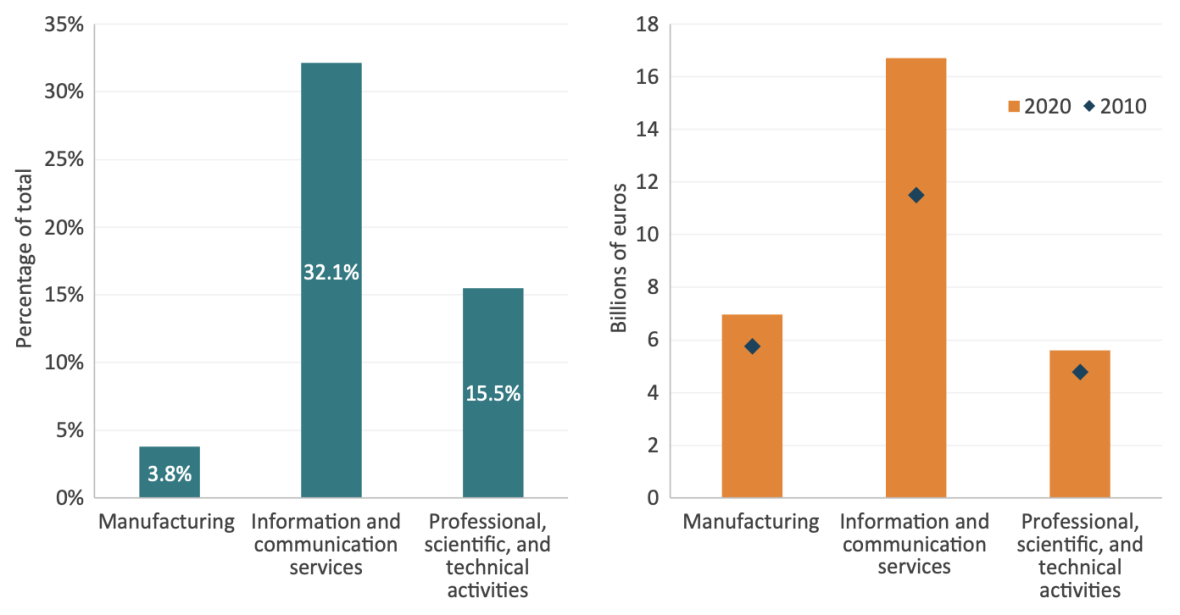
Figures 7a and Figure 7b illustrate sectoral investment in ICT equipment across ten EU economies.17 The left panel shows ICT investment as a share of total non-residential investment, averaged over the period 2010–2020. Unsurprisingly, information and communication services, along with professional services activities, have allocated a significantly higher proportion of investment to digital technologies, 32.1 percent and 15.5 percent, respectively, compared to just 3.8 percent in the manufacturing sector. Furthermore, while this share has remained relatively stable over time, the absolute investment amounts have grown at varying rates across sectors, as shown in the right chart. Investment in ICT in the information and communication services sector increased by EUR 5.2 billion, reaching EUR 16.7 billion in 2020. In contrast, this growth in manufacturing and professional activities was more modest, rising by EUR 1.2 billion and EUR 0.8 billion, respectively.
FIGURE 7A AND 7B: ICT EQUIPMENT INVESTMENT BY SECTOR FOR 10 EU COUNTRIES AS A SHARE OF NON-RESIDENTIAL INVESTMENT (LEFT, 2010–2020 AVERAGE) AND IN BILLION EUROS (RIGHT, 2010 AND 2020)
Source: ECIPE calculations based on EU KLEMS. Note: Investment is measured as Gross Fixed Capital Formation (GCFC) in chained linked volumes (2015).
The services sector is also a significant source of R&D and innovation, often having higher levels than those found in manufacturing firms. Moreover, service companies increasingly use modern “assets” and intangible capital, such as data, software, economic competencies, and specialized know-how, which further boost productivity. In many cases, firms in the services sector invest in intangible capital at a much greater scale than those in manufacturing industries.
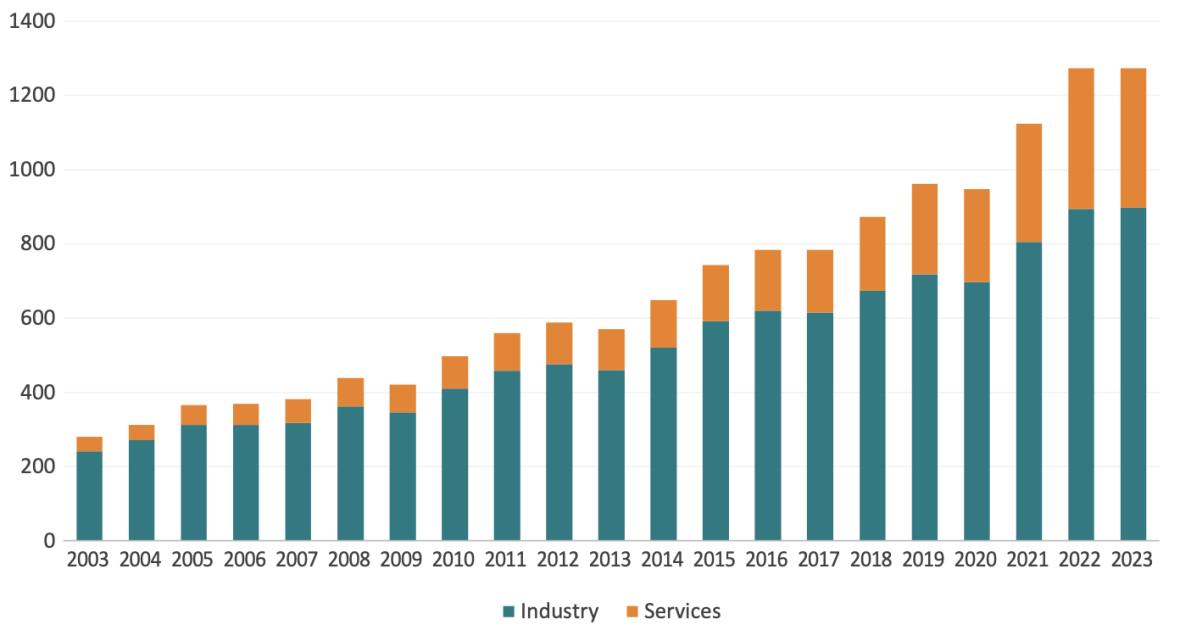
Figure 8 illustrates the evolution of global business R&D spending in the industry and services sectors from 2003 to 2023. The first key observation is that privately funded R&D expenditure has increased significantly worldwide over the past two decades, even when adjusted for inflation.
In 2023, global corporate R&D spending reached EUR 1,273 billion, compared to EUR 279 billion in 2003, an almost 5-fold increase over twenty years. This growth far outpaces the nearly two-fold increase in global GDP over the same period,18 reinforcing the well-established notion that research productivity is in decline, thus requiring ever greater R&D investment to drive innovation.19
A second notable trend is the rising importance of services within global corporate R&D expenditure. While industry R&D still accounts for approximately 70 percent of the total business R&D spending, its share has gradually declined in favour of services. In the early 2000s, services R&D represented less than 15 percent; today, it equals 30 percent of overall spending. Services have become more important in driving private sector innovation, and at the current pace, they are projected to close the gap with industry by 2051.20 However, this smaller share of services R&D spending overlooks the fact that many manufacturing firms have effectively transformed into service-oriented companies in the way they deliver their products. For example, IBM, which initially focused on hardware, has increasingly shifted its focus toward providing computer services, software, and research – areas where its R&D is now concentrated. A similar trend is seen in Europe with Siemens, which has transitioned from offering products to providing automation services.21
FIGURE 8: GLOBAL CORPORATE R&D SPENDING IN THE INDUSTRY AND SERVICES SECTORS, 2003–2023 (BILLIONS OF EUROS, INFLATION-ADJUSTED)
 Source: ECIPE calculations based on EU Industrial R&D Investment Scoreboard22 panel data.
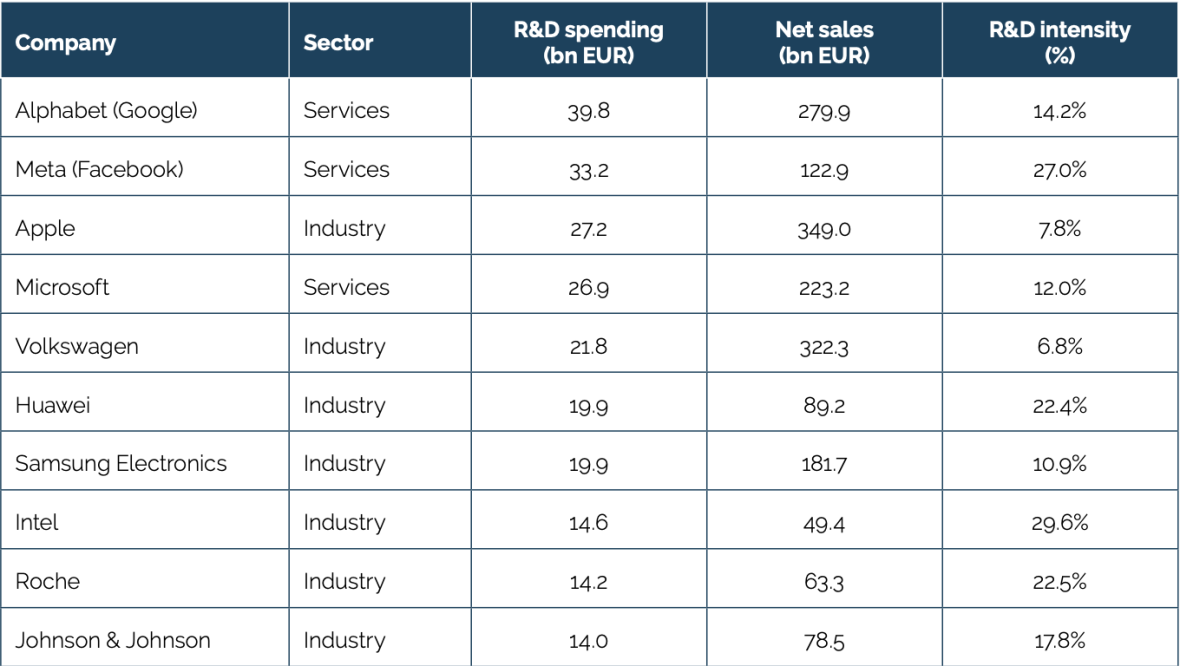
The significance of the service sector as a source of R&D and new innovations is evident even when shifting focus from aggregate trends to firm-level data. Many services firms often exhibit higher R&D intensity than manufacturing firms. For example, Table 1 presents the top 10 companies worldwide by R&D expenditure in 2023. Notably, three of the ten largest R&D spenders, all placed in the top 5, are services firms, collectively investing approximately EUR 100 billion in R&D. This figure is not far behind the EUR 132 billion devoted to R&D by the remaining seven industrial firms.
Interestingly, even when considering R&D intensity, measured as R&D expenditure relative to net sales (total revenue), there is no clear pattern indicating that industrial firms have a higher R&D intensity than services firms. Across the top 10 firms, the average R&D intensity of services companies is slightly higher than that of industrial companies. For instance, a computer services company like Meta has an R&D intensity comparable to that of a semiconductor firm like Intel, while Alphabet and Microsoft surpass industrial giants such as Samsung, Apple, and Volkswagen in this metric. Upon closer examination, at least among the world’s largest firms, the widely held belief that advanced manufacturing is inherently more innovation-intensive than services is unfounded.
TABLE 1: TOP 10 COMPANIES WORLDWIDE BY R&D SPENDING, 2023 (BILLIONS OF EUROS)
 Source: Authors’ calculations based on EU Industrial R&D Investment Scoreboard panel data.
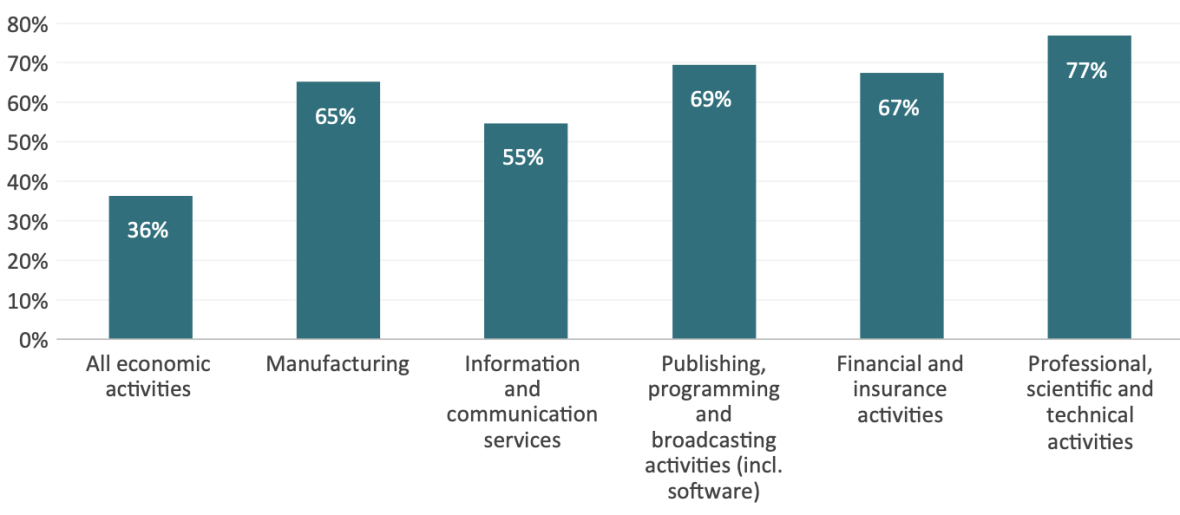
Finally, as noted, investments today increasingly occur in intangible assets such as data, software, economic competencies, and specialized know-how. In both the EU and the US, the share of these intangible investments has surpassed that of traditional investments in physical assets such asmachinery and equipment.23 A significant share of R&D and innovation through new technologiesis driven by intangible investments. In other words, investments in innovation, technologies, andintangibles are complementary.24 These investments, in turn, contribute to higher productivitylevels across sectors. Figure 9 shows investments in intangible assets as a share of Gross ValueAdded (GVA) in the Euro area across various industrial and service sectors, as well as for theeconomy as a whole.
While manufacturing boasts a high share of intangibles, several “global innovator” services (such as finance and professional activities) exhibit even greater shares. Information and communication services have a lower share overall, but when unpacking this aggregate sector, it becomes clear that one of their key subcategories of publishing, programming, and broadcasting activities (which includes software), demonstrates a higher intangible share than manufacturing. A growing body of economic research highlights that, even in Europe, intangibles are key drivers of firm growth, productivity, and innovation, comparable to other well-established indicators such as R&D.25 The fact that certain service sectors exhibit higher shares than manufacturing underscores their significant contribution to overall economic growth, challenging the notion that growth can only be achieved by the manufacturing sector.
FIGURE 9: TOTAL INTANGIBLES AS A SHARE OF GROSS VALUE ADDED (GVA) IN THE EURO AREA, 2021 (PERCENTAGE)
 Source: ECIPE calculations based on EUKLEMS & INTANProd data.26 Note: Euro area countries include Austria, Belgium, Croatia, Cyprus, Estonia, Finland, France, Germany, Greece, Ireland, Italy, Latvia, Lithuania, Luxembourg, Malta, the Netherlands, Portugal, Slovakia, Slovenia and Spain.
2.3 Trade in services
A long-standing view among economists and policymakers was that services are non-tradable, as either the producer or the consumer typically needed to move across borders to deliver the service, resulting in high trade costs. Additionally, regulatory barriers imposed by countries over the years have often made it more difficult for firms to export or import services. However, this has begun to change with technological developments over the past two decades. Trade costs in services have decreased significantly thanks to digital technologies like the internet and cloud computing, leading to a higher level of tradability for many services, particularly those provided by global innovators.27
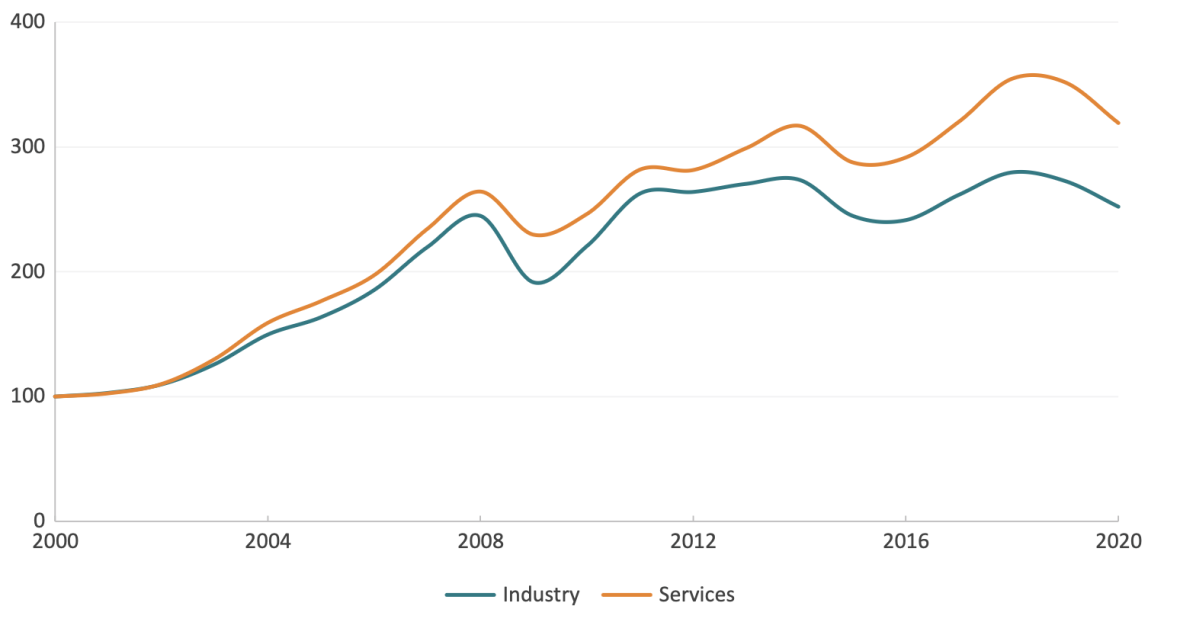
EU companies are increasingly harnessing trade in services as a driver of growth, contributing to a structural transformation of the European economy. 28 Figure 10 illustrates that, since 2000, exports of EU services to countries outside the Union have grown at a faster pace than exports of industrial goods. This is a trend that is also observed globally, in particular for services that are digitally delivered, such as finance, information and communication, professional activities, as well as health and education.
FIGURE 10: EXTRA-EU GROSS EXPORTS BY SECTOR, 2000–2020 (INDEX, 2000 = 100)
 Source: ECIPE calculations based on OECD TiVA.
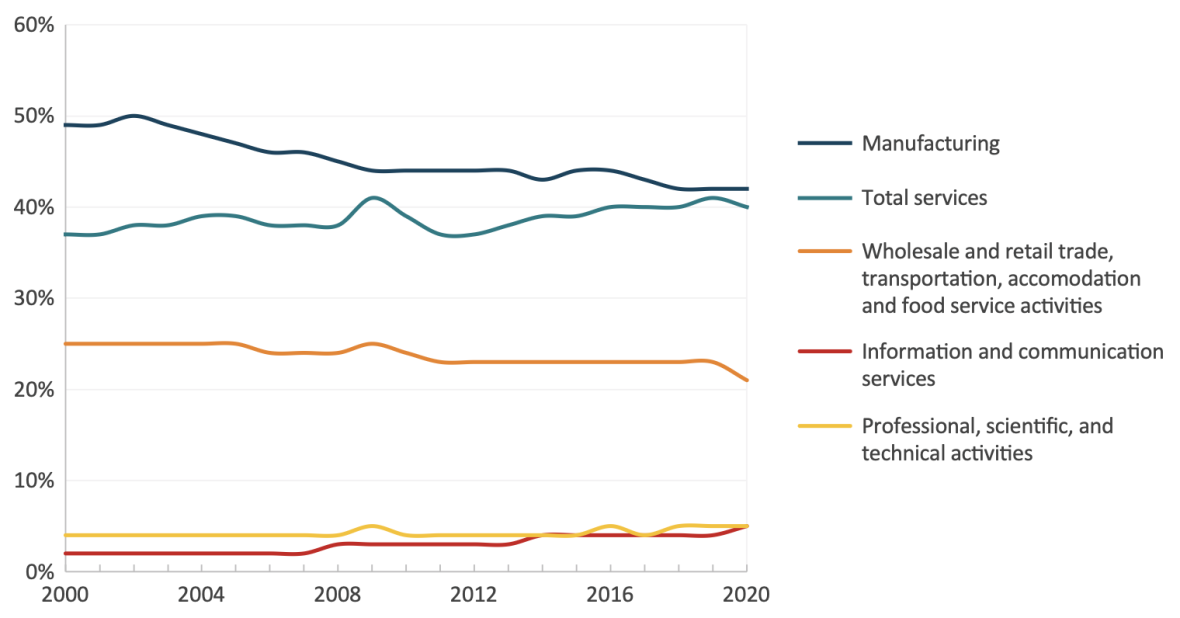
Moreover, many services activities also carry higher levels of value-added when exported. The trend shown in the previous Figure 10 typically captures gross trade in services. Many goods and services cross borders multiple times, risking inflating this gross measure of trade. Using trade in value-added data nets out this double counting and measures the contribution of domestic value added in trade. Figure 11 shows that on this metric, services have now converged to that of the manufacturing sector. Both sectors currently contribute approximately 40 percent domestically to total gross exports. At the same time, the domestic share of value added from manufacturing has declined markedly, falling from 49 percent in 2000 to 42 percent in 2020.
Another notable trend related to Figure 11 is the steady increase in domestic value added from information and communication services and professional activities. In fact, the domestic contribution of value-added in exports has now exceeded that of the computer and electrical equipment manufacturing sector. Moreover, both services sectors contribute to total services value-added in exports to an almost similar amount. The shift of these examples underscores the growing significance of services as driving forces of EU exports and global trade competitiveness more broadly.29
FIGURE 11: INDUSTRY DOMESTIC VALUE ADDED CONTRIBUTION TO GROSS EXPORTS IN THE EU-27 (PERCENTAGE OF TOTAL GROSS EXPORTS)
 Source: ECIPE calculations based on OECD TiVA. Notes: Trade at the EU-27 level excludes intra-EU trade and relates to trade with external partners of the EU. In other words, trade between Member States is omitted.
3.1 Productivity, TFP and value-added.
When examining productivity in services in the EU, it is natural to compare with the US. The US is one of the most successful examples of a large economy that has become wealthier due to increased productivity in services, much more than the EU has over the same period. Although political discourse for a decade now has emphasised manufacturing as the main driver of US prosperity, a closer look at the data clearly shows that this is not the case.30
Perhaps the most compelling piece of evidence on the EU’s failure to keep pace with the US in services, and which causes to be the primary factor in the widening transatlantic productivity divide, is Mario Draghi’s report on The Future of European Competitiveness. In this report, Draghi highlights how the EU’s gap in aggregate labour productivity relative to the US is largely the result of the Union experiencing significantly less activity in the sectors where the bulk of productivity growth has occurred, particularly in ICT and digital services.31
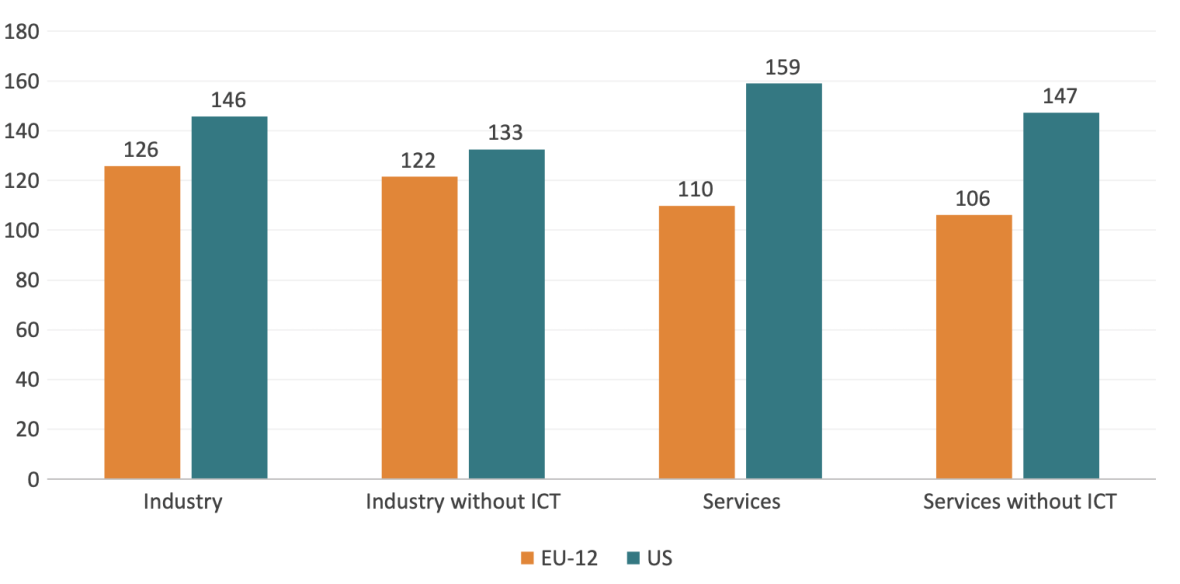
Draghi’s observations are not merely assertions; they are clearly reflected in the data. Figure 12 illustrates hourly labour productivity for the EU-12 and the US in 2021, expressed as a multiple of 2001 by setting this year to 100. The figure clearly shows that the greatest productivity growth has occurred in the US services sector, especially when including ICT. In contrast, the EU has seen the bulk of its productivity growth in industry, although still at a slower pace than the US.
FIGURE 12: INDUSTRY DOMESTIC VALUE ADDED CONTRIBUTION TO GROSS EXPORTS IN THE EU-27 (PERCENTAGE OF TOTAL GROSS EXPORTS)
 Source: ECIPE calculations based on EUKLEMS & INTANProd data.32 Note: ICT economic activities in industry encompass the manufacturing of computers, electronic and optical products, as well as the production of electrical equipment. In contrast, ICT services include software development, telecommunications, computer programming, and other information service activities.
However, the most significant disparity between the EU and the US is precisely in the services sector, particularly in digital services. Between 2000 and 2020, productivity within services in the US increased by a remarkable 60 percent, whereas the EU experienced only a 10 percent increase. This evidence alone would be enough to dispel the manufacturing obsession that, in opposite yet paradoxically complementary ways, now affects both sides of the Atlantic.
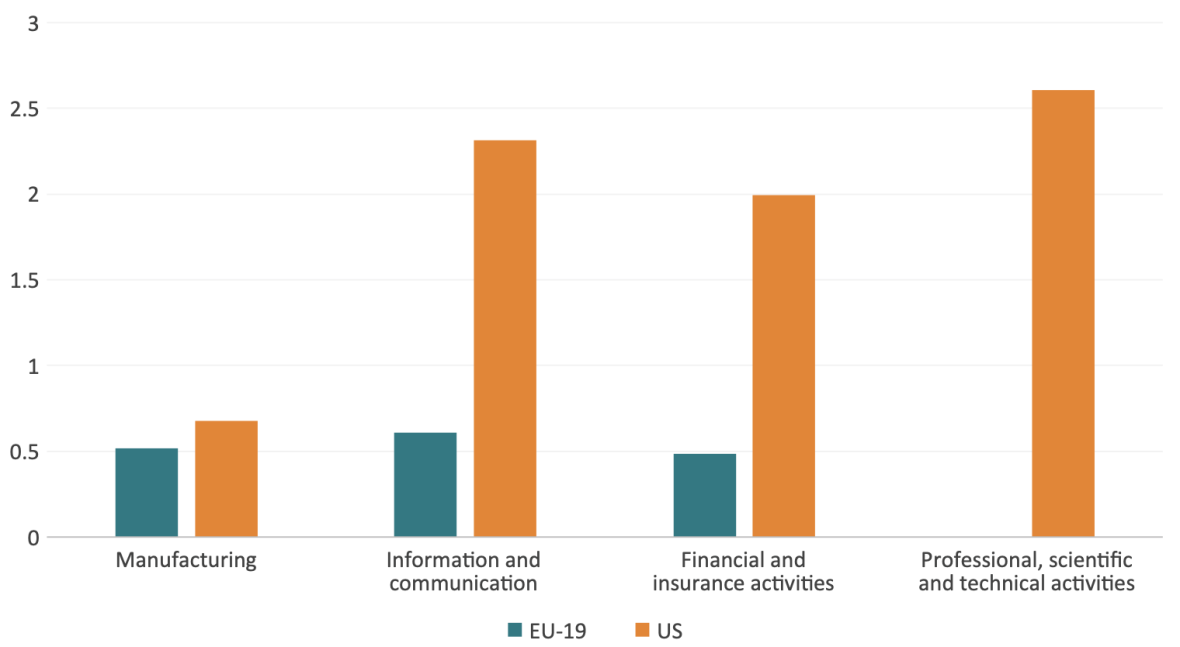
A more refined measure of productivity is Total Factor Productivity (TFP), which captures the extent to which firms utilize resource factors such as labor and capital through the adoption of new technologies. Given the substantial investments by services firms in digital technologies and ICT equipment, it is reasonable to expect that TFP has played an increasingly significant role in driving productivity and value creation within the services sector. This expectation is supported by the data presented in Figure 13, which shows a particularly strong TFP contribution to overall labor productivity growth in the global innovator services. However, the US has outperformed the EU in harnessing TFP gains in these sectors, highlighting a transatlantic gap in productivity dynamics.
FIGURE 13: TFP CONTRIBUTIONS TO VALUE ADDED GROWTH PER HOUR WORKED, 2021 (PERCENTAGE POINTS)
 Source: ECIPE calculations based on EUKLEMS & INTANProd data. Data for Professional, scientific and technical activities is missing at the EU level.
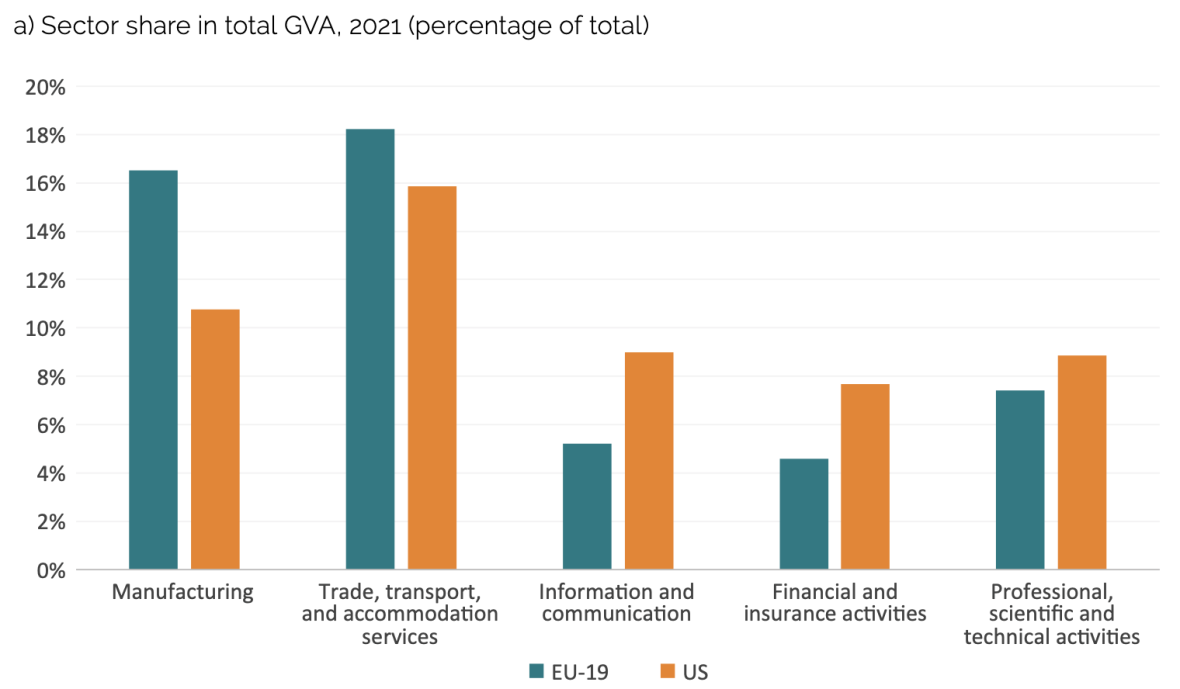
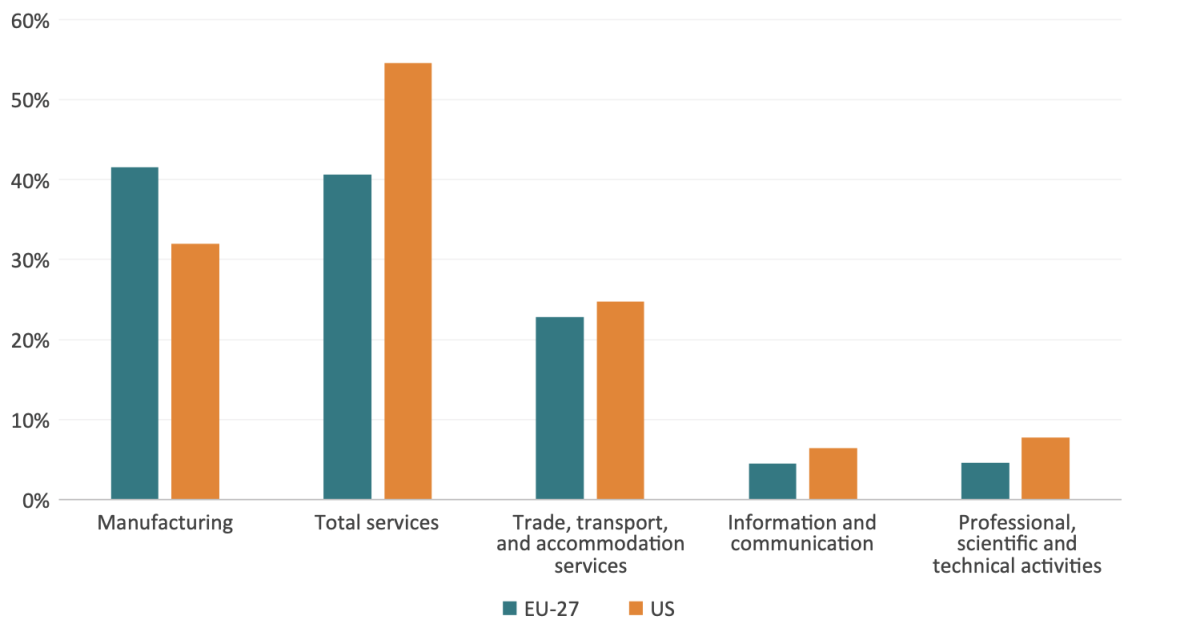
As sectors become more productive, they also generate their own demand, resulting in a greater share of value added in the overall economy. In the United States, advanced services sectors with higher productivity growth contribute a larger share of gross value added, as shown in Figure 14a, highlighting the country’s strong comparative advantage in these sectors. The figure also indicates that the EU still maintains a higher share of value added in manufacturing and other services such as trade, transport, and accommodation compared to the US. Moreover, growth in gross value added in services tends to be faster in the United States, as shown in Figure 14b.
FIGURE 14A AND 14B: GROSS VALUE ADDED (GVA) BY SECTOR IN THE EU-19 & US
 Source: ECIPE calculations using Euklems & INTANProd database, 2024 release
3.2 Investment in R&D and intangible capital
Now that we have established that the bulk of the productivity and value-added growth disparity between the EU and the US lies in services, the natural next step is to explore its underlying causes. As the Section 2 explained, productivity advances are closely tied to firm investments in new digital technologies, R&D and innovation, and intangible capital, especially for services.
Earlier research showed that disparities in private sector innovation not only underpin the EU-US productivity gap33 but also divergences between other economies, from South Korea and Japan34 to Sweden and Switzerland.35 If productivity gaps are largely driven by differences in firm-level innovation, then addressing these disparities requires recognising that innovation capacity is closely linked to the level of R&D investment. In other words, variations in R&D expenditure across firms and regions play a critical role in shaping productivity outcomes and, by extension, broader economic competitiveness.
Our research shows indeed that the scale of private sector spending on innovation in an economy has a profound impact on productivity and overall economic prosperity.36 Success stories such as Airbus catching up, and eventually outperforming, with Boeing in aviation, or, conversely, SpaceX outpacing Europe’s once-thriving space industry, illustrate how EU-US rivalries in the manufacturing sector often come down to the scale and direction of research and innovation spending.37 The question is whether the same dynamics apply to services now that the sector has become more important in driving private sector innovation.
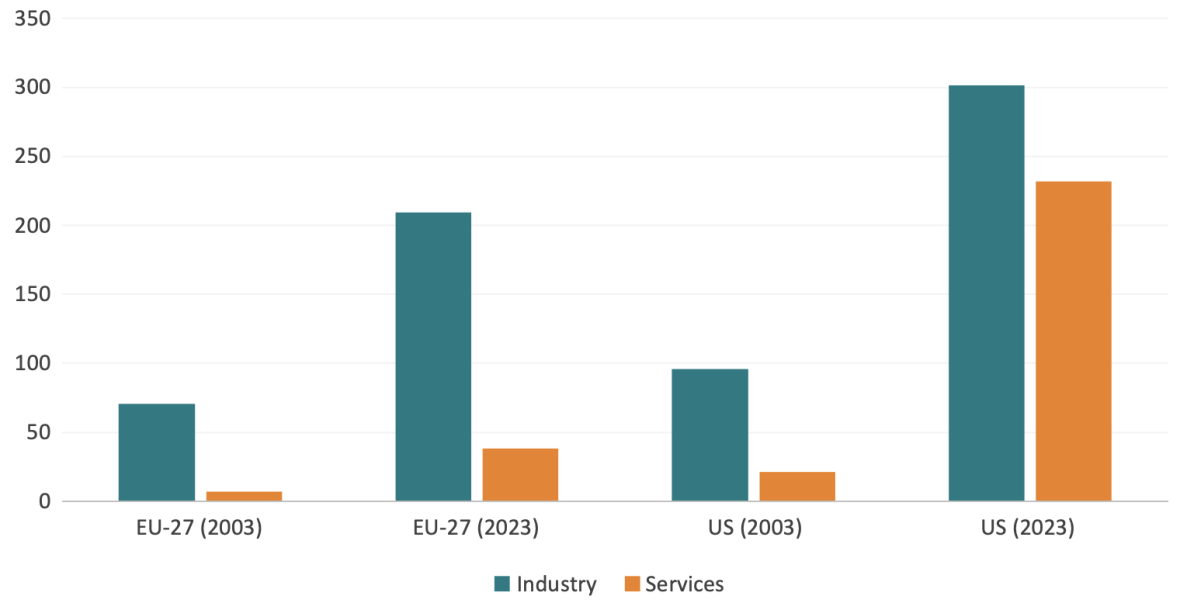
To answer this, we use data from the EU Industrial R&D Investment Scoreboard,38 which tracks privately funded business R&D spending from 2003 to 2023 for the world’s top corporate spenders, covering 80-90 percent of global R&D expenditures. Figure 15 presents inflation-adjusted corporate R&D spending (in billions of euros) for EU and US industry and services companies in 2003 and 2023. The figure shows that the differences between these two periods across the EU and the US are striking, particularly for services.
First, both EU and US companies have significantly increased their R&D investments over the past two decades. In 2003, R&D spending in both regions was heavily concentrated in industry. By 2023, however, R&D investment had not only grown substantially overall but also diverged markedly in direction and intensity. While business R&D spending roughly tripled in both the EU and the US, reaching EUR 301 billion and EUR 210 billion respectively, the growth in services-related R&D was far stronger in the US. There, R&D spending in services surged more than tenfold, from EUR 21 billion in 2003 to EUR 232 billion in 2023. In contrast, the EU’s services R&D increased fivefold, from a lower base of EUR 7 billion to EUR 38 billion over the same period.
As a result, while US business R&D spending is now only about 1.3 times higher than that of the EU, its services R&D spending is nearly six times greater. This marks a significant shift from the early 2000s, when the EU and the US had relatively similar R&D profiles. Two decades later, the US has clearly expanded its investment in services R&D, creating a notable divergence between the two economies.
FIGURE 15: CORPORATE R&D SPENDING IN THE INDUSTRY AND SERVICES SECTORS FOR THE EU-27 AND THE US, 2003 AND 2023 (BILLIONS OF EUROS, INFLATION-ADJUSTED)
 Source: ECIPE calculations based on EU Industrial R&D Investment Scoreboard panel data.
One possible explanation for this stark discrepancy is the difference in the relative size of the industry and services sectors in the EU and the US. In this view, services-producing firms might represent a larger share of GDP and employment in the US, which could justify the significantly higher level of R&D spending in services. If the US economy is more oriented toward services, it would follow that the scale of services-related R&D investment would also be proportionally greater.
However, this argument does not hold up. In 2023, services accounted for 76.4 percent of GDP in the US and 65.5 percent in the EU. These shares have grown similarly over the past two decades – from 74.6 percent in 2003 in the US and 63.6 percent in the EU. While the US has a somewhat larger services sector, the pace of growth has been comparable across both regions. This parallel trajectory in broad sectoral composition simply cannot explain the dramatic divergence in services R&D spending. In other words, the relatively similar role of services in both economies does not justify a sixfold difference in investment levels in the US.
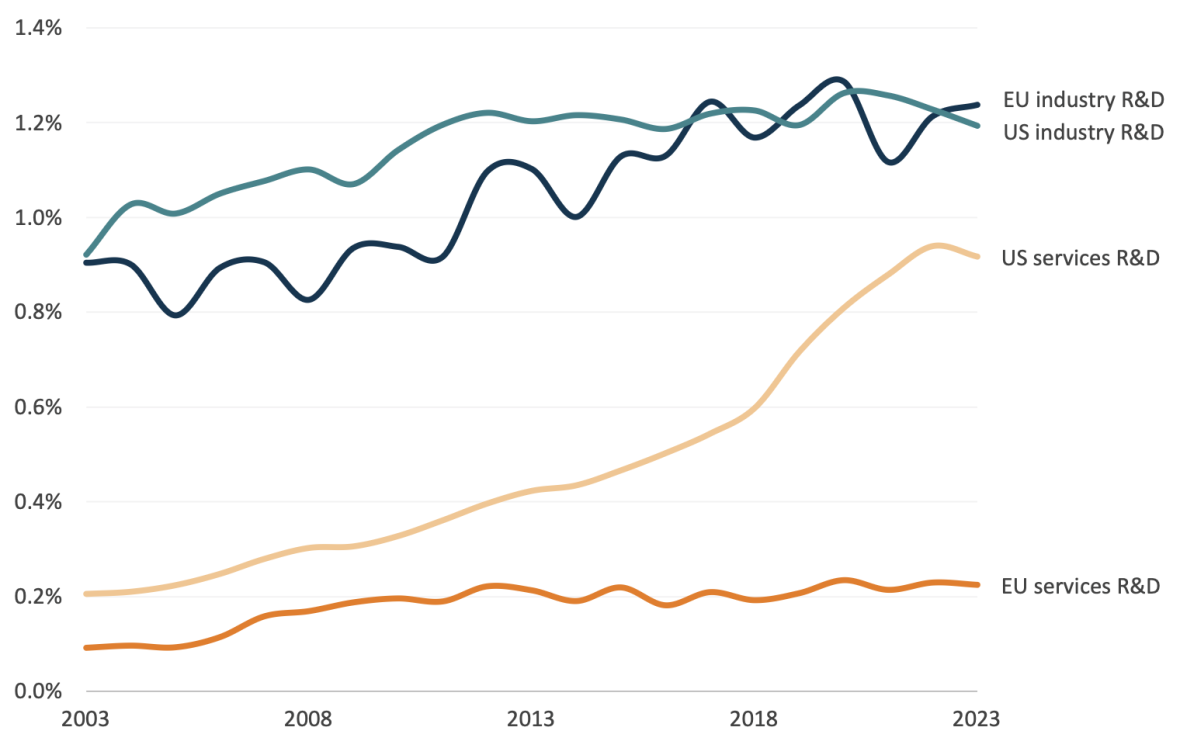
What ultimately matters is the extent to which R&D is used intensively within the production process. In the US, R&D plays a significantly larger role relative to the size of the economy. This higher R&D intensity helps to explain the widening long-term productivity gap between the US and the EU, particularly in the services sector. Figure 16 illustrates that, while total R&D spending by the largest companies in both the EU and the US has remained relatively similar as a share of GDP, the picture is markedly different when it comes to services. From the early 2010s onward, services R&D investment in the US accelerated sharply, reaching 0.9% of GDP by 2023. In contrast, services R&D in the EU stagnated at around 0.2% of GDP. In sum, even after accounting for differences in economic size, the gap in services R&D intensity between the US and the EU remains striking.
FIGURE 16: CORPORATE R&D SPENDING IN THE INDUSTRY AND SERVICES SECTORS AS A SHARE OF GDP FOR THE EU-27 AND THE US, 2003–2023 (PERCENTAGE OF GDP)
 Source: ECIPE calculations based on EU Industrial R&D Investment Scoreboard panel data.
That said, discussions about closing the innovation gap in manufacturing R&D spending are not completely misplaced. While the overall volume of industry R&D expenditure is broadly similar in the EU and the US, substantial evidence suggests that the EU should pursue policies that help incentivise more of this spending towards high-tech sectors, such as ICT services, rather than middle-tech industries, like automotive. Doing so would help spread innovations beyond their sectors of origin.39 Prioritising industry R&D and more industrial policy would be a mistake. The data makes clear that the EU’s R&D spending shortfall is, first and foremost, in services.
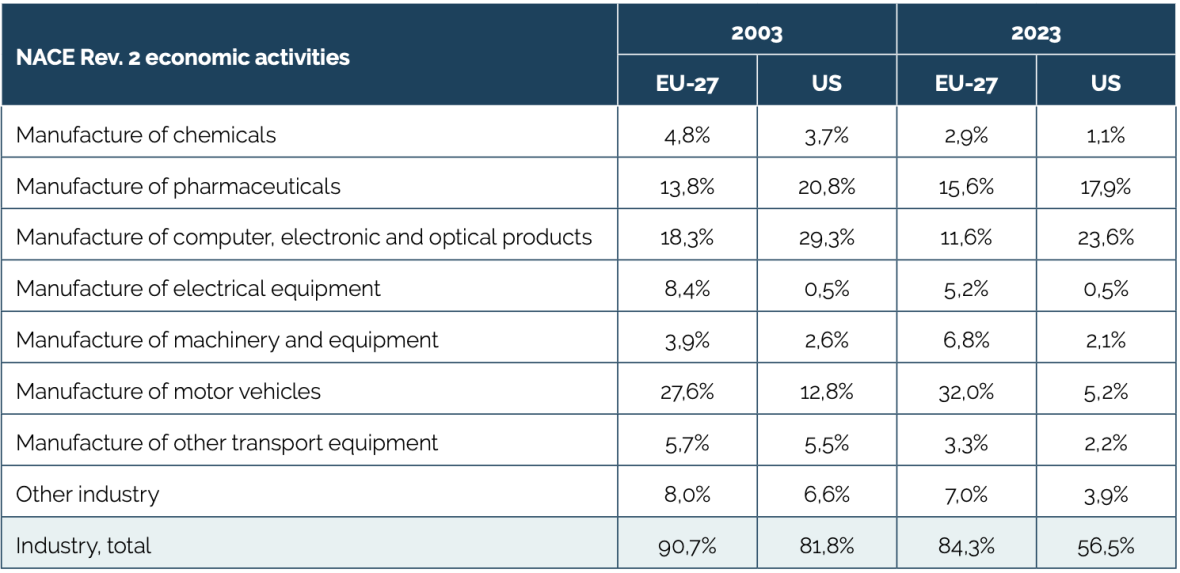
To gain a clear understanding of the services R&D challenge, it is essential not only to examine the volume of expenditures, as done so far, but also to analyse their composition. Table 2 breaks down industry and services R&D spending for the EU and the US by economic activity, comparing 2003 and 2023.
The first key observation is that, in the early 2000s, the vast majority of corporate R&D spending in both regions was concentrated in industry – 90.7 percent in the EU and 81.8 percent in the US. By 2023, however, this distribution had shifted dramatically, but only in the US. While the share of industry R&D spending in the EU had declined only slightly to 84.3 percent, in the US it had fallen significantly to 56.5 percent. Consequently, services R&D spending in the EU accounted for just 15.3 percent of total corporate R&D, whereas in the US it had surged to 43.5 percent.
Even more revealing is the breakdown of services R&D spending by economic activity. In the US, the most important categories are computer programming, which represent 18.6 percent of total business R&D spending, software with a share of 15.8 per cent, and scientific and research development with a share of 4.6 per cent. In the EU, while computer programming is also the leading category for services R&D spending, scientific and research development and software remain largely irrelevant. Instead, financial services and telecommunications rank second and third, respectively, in the bloc’s sectoral R&D composition. However, their combined shares still fall short of matching the substantial R&D spending in the leading US services sector.
As demonstrated in the previous chapter, both software and scientific research and development rank among the most productive sectors of the economy. It is therefore reasonable to conclude that the EU not only allocates an insufficient share of business R&D spending to services but also fails to incentivise investment towards the most innovative and high-growth sectors. It is highly likely that there is composition effect at the heart of this problem: the EU has pursued industrial policy and regulations that have constrained the growth of software and scientific research services, leading to a relative decline in business R&D intensity compared to the US.
It is notable, for instance, that the EU and its Member States have developed regulations of the digital economy that are more restrictive for experimentation, innovation, and services business growth than in the US. In many European countries (e.g., Germany) the services sector has for long been held back by industrial and economic policies that have favoured manufacturing industries – including labour-market policies and public R&D initiatives that reflect an older, industry-based idea of the economy. Labour regulations come in different shapes and forms across the EU, but a notable feature of them in services is occupational licenses which deprive service professionals to operate across borders.40
Add to that the new forms of digital regulation – ranging from the EU’s General Data Protection Regulation (GDPR) to the Artificial Intelligence Act – and it is clear that services-sector modernisation and growth have been suppressed. European services companies are generally far less data-intense than in the US, and they do not invest as much in software development as their American peers. This pattern is particularly strong for EU services companies in ICT and scientific services.
Another factor that restrains sector size and R&D intensity in Europe’s ICT and scientific services is EU market fragmentation. There is no proper single market for services in the EU. In the first place, the home market bias remains very strong, leading many services companies to operate mostly within national markets. But regulation also adds additional burdens on the internationalisation of services companies. For services, there is not much Europe-wide harmonisation and mutual recognition is not standard operating procedure when there is significant national variation in implementing basic EU rules. For instance, data protection bodies in the EU interpret the GDPR in different ways. In some countries, compliance also requires working with many local or sub-
federal bodies, adding additional costs. For small ICT services companies in the EU, the GDPR alone has been estimated to reduce profits by 12 percent.41
The result is that it is more difficult to scale services in Europe. Mario Drahi highlighted this problem in his report on The Future of European Competitiveness, and pointed the impact of high internal barriers in EU services market for general services firm growth and, specifically, for ICT services firm growth. The International Monetary Fund (IMF) has also calculated the size of internal regulatory barriers in the EU services market. While regulatory barriers in the EU adds the equivalent of a 45 percent tariff on exports of goods from another EU country, it is far higher for services – 110 percent.42 In other words, expanding services across borders within the EU faces very substantial barriers.
TABLE 2: COMPOSITION OF INDUSTRY AND SERVICES R&D EXPENDITURE BY ECONOMIC ACTIVITY FOR THE EU-27 AND THE US, 2003 AND 2023 (PERCENTAGE OF TOTAL)
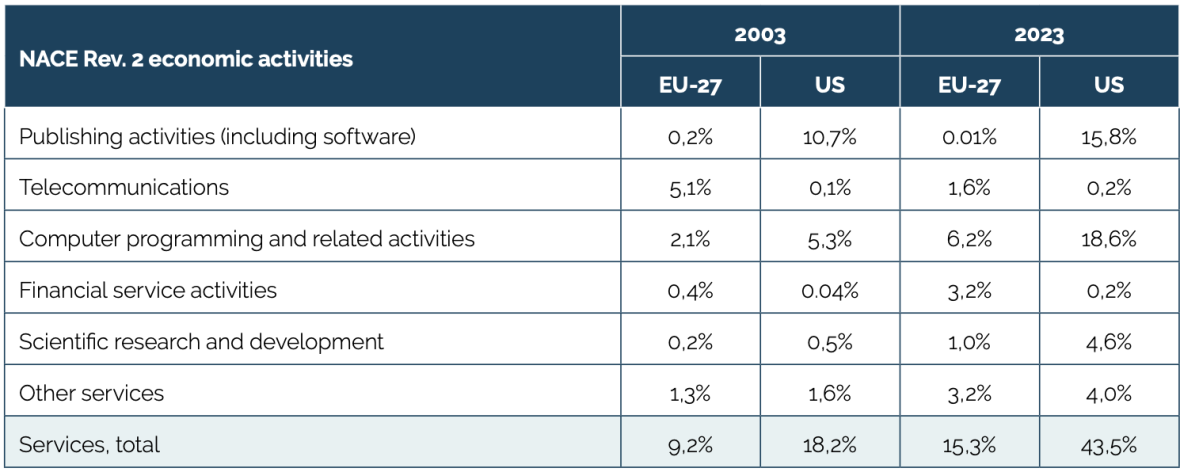 Source: ECIPE calculations based on EU Industrial R&D Investment Scoreboard panel data. Note: The percentages do not sum to 100% for the EU-27 in both 2003 and 2023, as a very small share of R&D spending is performed by the agricultural sector.
Therefore, if the EU and its Member States wish to close the innovation and productivity gap with the US, they must rethink their general policy attitude to services and pursue policies that incentivise a more balanced distribution of R&D spending between industry and services, and that leads to faster services growth. Within services, special attention should be given to digital services and scientific research. Such policies need to start with opening markets in Europe and create much better conditions for selling services across borders. Regulatory burdens need to come down and, generally, regulations should be tailored to avoid lots of extra compliance as soon as a company expands from one EU country to another. Moreover, more tailored approaches should also be considered – for instance by expanding tax incentives for R&D spending in the services sector.
A valuable point of reference is the US given its leading role in R&D. This is not to suggest that the EU should blindly replicate the sectoral composition of R&D spending in the US. In the first place, this cannot easily be achieved but requires policy reforms that over time accelerate the growth of the services sector. However, the hypothetical scenario helps to clarify the magnitude of the structural changes required.
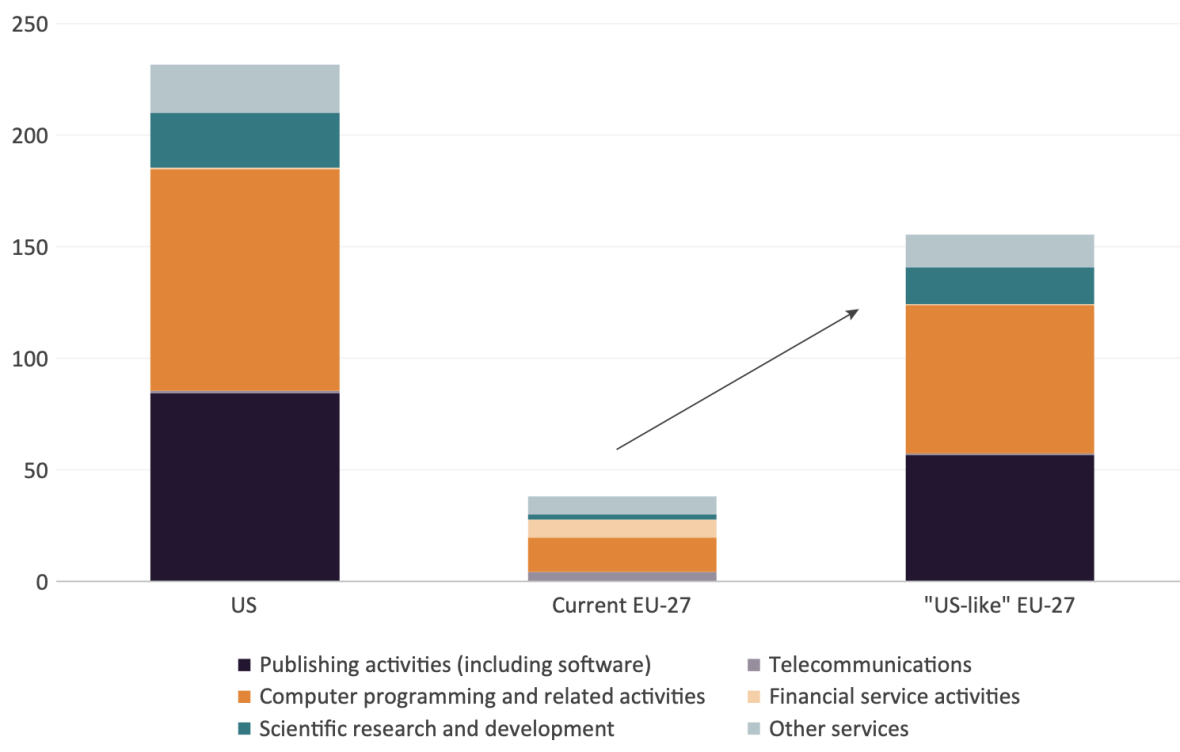
As demonstrated earlier in Figure 16, industry R&D spending is already comparable between the EU and the US as a share of GDP. This means that nearly all of this increase in business R&D spending would need to occur in services. Setting aside detailed considerations on the composition of industry R&D spending, we focus exclusively on services R&D. Figure 17 below provides a rough estimate of what a “US-like” scenario for the EU would look like in terms of both total volume and composition of services R&D spending by economic activity.
In this scenario, the EU business sector would need to spend approximately EUR 155 billion on services R&D, which is more than four times its current level. This substantial increase would drive growth across nearly all economic activities. However, the most significant transformations would occur in three key areas: computer programming (rising from EUR 15 billion to EUR 66 billion), scientific and research development (from EUR 2 billion to EUR 17 billion), and, most dramatically, software (from a mere EUR 30 million to EUR 57 billion, an astonishing 2,000-fold increase).
FIGURE 17: SERVICES R&D SPENDING DISTRIBUTION BY ECONOMIC ACTIVITY FOR THE US, THE EU-27 AND A “US-LIKE” EU-27, 2003 (BILLIONS OF EUROS)
 Source: ECIPE calculations based on EU Industrial R&D Investment Scoreboard panel data.
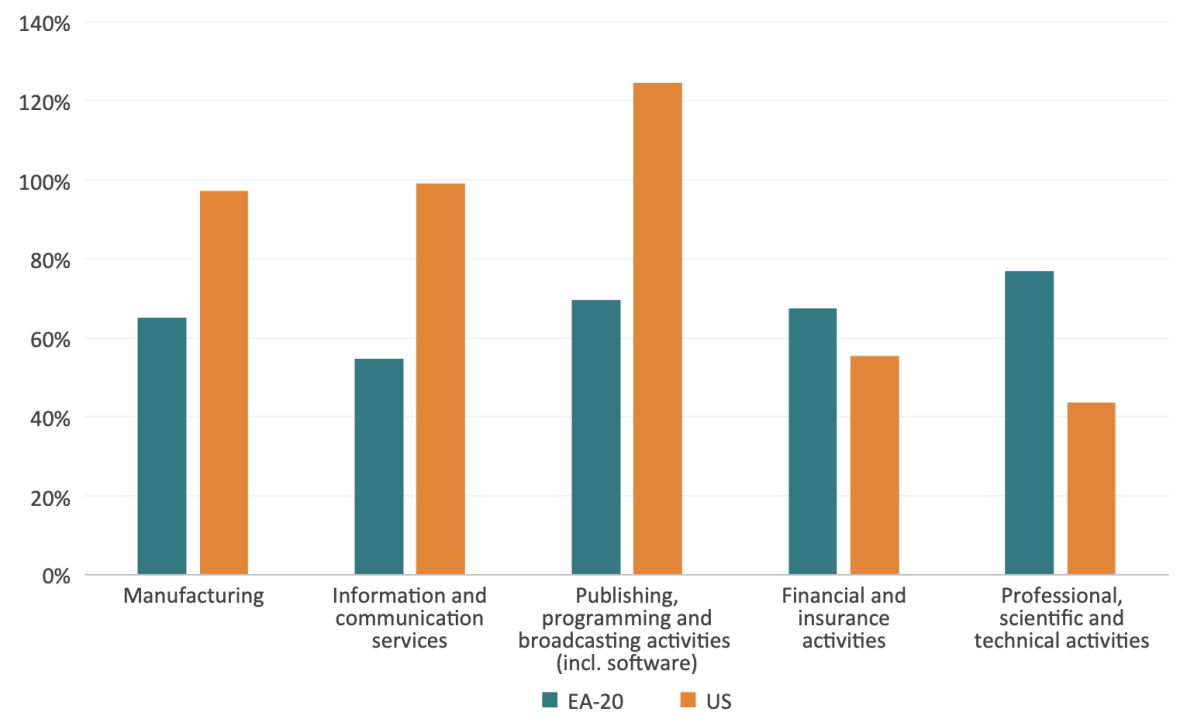
Investments in R&D and new technologies are most effectively employed when they are invested together with other intangible assets. Many services sectors show higher rates of intangible asset investments, which coupled with greater R&D and ICT investments pushes up their performance in the US compared to the EU. Figure 18 shows that the US leads in particular intangible investments as a share of value added in information and communication as well as other information services. Notably, intangible investments in manufacturing are also higher in the US compared to the EU. The EU, however, excels in greater intangible investments in finance and other professional services activities.
FIGURE 18: TOTAL INTANGIBLES AS A SHARE OF GROSS VALUE ADDED (GVA), 2021 (PERCENTAGE)
 Source: ECIPE calculations using Euklems & INTANProd database, 2024 release
3.3 Trade in services
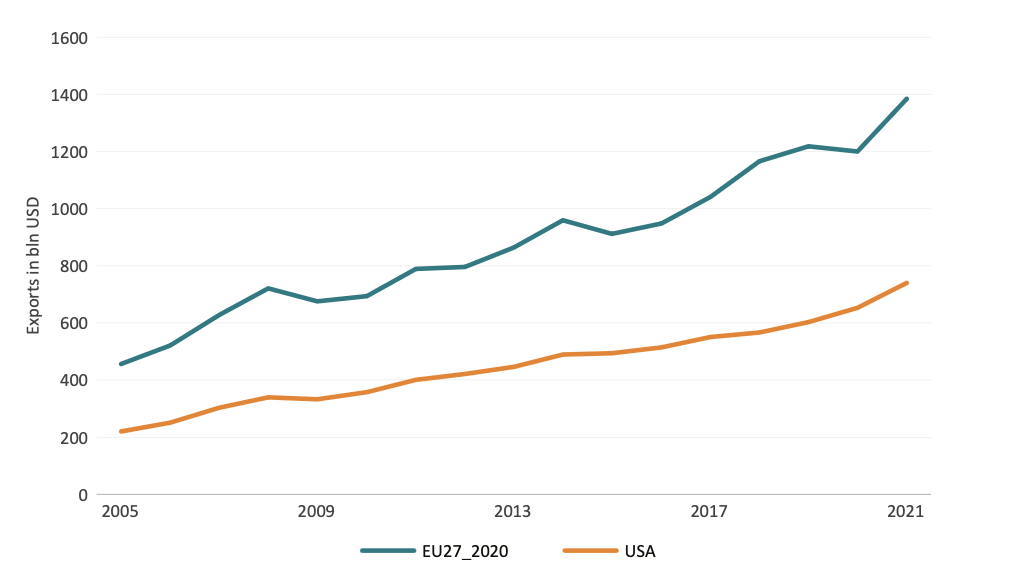
Finally, the differences between the EU and the US in performance and investments in industry and services are borne out as well when looking at trade patterns. Even though the EU is a giant when it comes to services trade, given that its export performance in services is twice as large compared to the US. As can be seen in Figure 19, this gap has widened over the years as well. The EU holds strong comparative advantage in sectors such as professional services, and even computer and related services. The result is that trade in services takes up a much larger role for the EU than for the US, boosting its external competitiveness.
FIGURE 19: TOTAL COMMERCIAL SERVICES TRADE FOR THE EU AND US (2005-2021), BLN USD
 Source: ECIPE calculations using OECD-WTO BaTiS.
However, a closer examination of the underlying value-added in exports reveals that the US economy is more dynamic. As previously mentioned, trade figures are often reported in gross terms, as shown in Figure 19. However, when isolating the net domestic value-added in services trade across sectors, it becomes evident – as illustrated in Figure 20 – that the US records higher levels of domestic value-added in its exports. This difference is most likely driven by greater investment in R&D and other intangible assets across many US service sectors, which enhances the value-added content of its exported services.
FIGURE 20: INDUSTRY DOMESTIC VALUE-ADDED CONTRIBUTION TO GROSS EXPORTS, 2020 (PERCENTAGE OF TOTAL GROSS EXPORTS)
 Source: ECIPE calculations using OECD TiVA.
Building on the previous analysis, this chapter explores how the European economy could evolve with a more dynamic and competitive services sector. It envisions a future where services drive growth, innovation, and productivity across the EU – unlocking untapped potential and accelerating economic transformation. We include concrete calculations and estimates that highlight the economic impact of a thriving services sector, analysing both the effects of a stronger and more productive services sector, as well as expanding services trade through reduced trade costs.
In this work, we have focused on Europe’s global trade, both exports and imports. As we noted above, the EU is a significant trader in services – more so than the US – and given its services-sector industry profile (e.g., sector and firm-size distribution) trade in services will be crucial for the EU to boost its economic performance. It has also been noted that regulatory barriers in the EU alone add up to what is equal to a very substantial tariff. In the EU’s services trade with countries outside of the EU, this tariff equivalent for services is even higher.
While often ignored in public policy, trade plays a significant role for boosting productivity in services. Obviously, getting access to more customers through trade means that services firms can invest more in both scale and specialisation. Services trade also has a significant impact on services professionalisation, leading to more people that are employed in structured services performance. As a result, shows the OECD, the productivity performance of services increases substantially when trade is liberalised.43 Moreover, the growth of many digital trade restrictions has impacted negatively on trade in services for exactly the category of services where the EU is trailing the US – especially ICT and scientific data-intense services.44
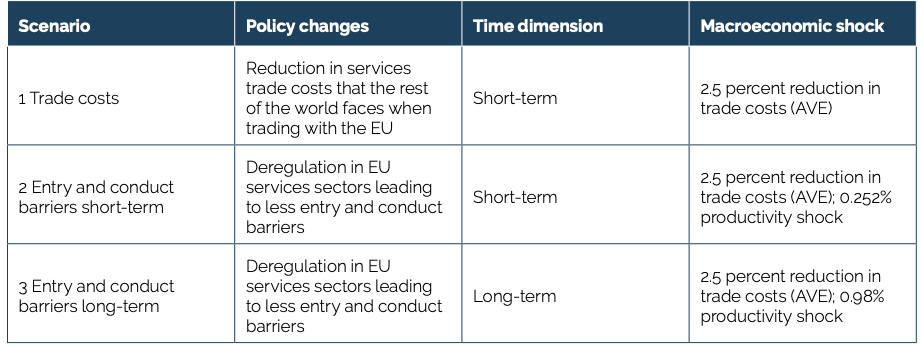
To estimate the effects of a small reduction in barriers to services trade, we employ a macroeconomic computable general equilibrium (CGE) model simulating economic gains if EU trade in services were as open as goods trade, and simulating a significant reduction in overall services regulations in the EU.
Overall, we simulated 3 different scenarios. Scenario 1 covers a reduction in services trade costs that the rest of the world faces when trading with the EU in the form of a 2.5% trade cost ad valorem equivalent (AVE) following the recent work by the IMF.45 The additional 2 scenarios assume a reduction in services trade costs as well as productivity increases in EU services sectors based on regulatory policies in the form of reduction of regulatory entry and conduct barriers, based on productivity coefficients.46 It is assumed, therefore, that this reduction in regulatory policies has a direct impact on the ability to services sectors to become more productive which happens through better use of resource inputs, value-added creation, as well as investments in ICT, R&D and intangibles, as we have seen above.
The estimated coefficients employed assume a scenario for an average EU country facing a reduction in overall services regulations to a targeted average level of the three most deregulated European economies which would lead to a significant increase in the level of firm productivity performance. These scenarios are performed for both short-term as well as long-term economic effects.
Scenario 2 focuses on compound short-term effects of both entry barriers and conduct barriers, while scenario 3 combines compound effects of both for a long-term perspective of economic impacts. Short-term effects are immediate, while long-term scenarios simulate compound effects after 5 years. The results include GDP and services sector output as an indication of welfare and employment. An overview of the individual scenarios as well as the resulting macroeconomic shocks is provided in Table 3.
TABLE 3: OVERVIEW OF POLICY CHANGES
 Source: ECIPE calculations.
We translated established productivity coefficients47 into CGE productivity shocks that can be plugged into our macroeconomic modelling following Gal et al. (2019).48 The productivity shocks are based on availability of technology and the theoretical link is that less regulatory barriers would allow EU companies to increase their access to latest technologies, thus increasing their productivity. This is how productivity can be applied in our latest GTAP model (for more information see Technical Annex).
Note that the scenarios employed are conservative and the results can be taken as lower bound estimations of effects. Also, the assumptions of the scenarios assume a realistic and significant reduction of domestic regulatory barriers, but not a complete finalisation of the single market in services.
4.1 Findings and interpretation of results
The results from the CGE modelling reveal that especially the productivity scenarios result in significant GDP increases for the EU. The GDP gains for the trade costs scenario are relatively smaller. Short-term productivity effects are lower than long-term productivity effects, as long- term productivity effects result from cumulated increases of productivity growth and progressively higher levels of productivity over the span of 5 years. The highest GDP gains would amount to 1.6 percent of EU wide GDP growth in the case of the long-term scenario of a reduction of both entry and conduct barriers. Figure 21 presents a summary of results.
FIGURE 21: ESTIMATED INCREASE IN EUROPE’S GDP IN THE SHORT AND LONG TERM (IN PERCENTAGE TERMS)
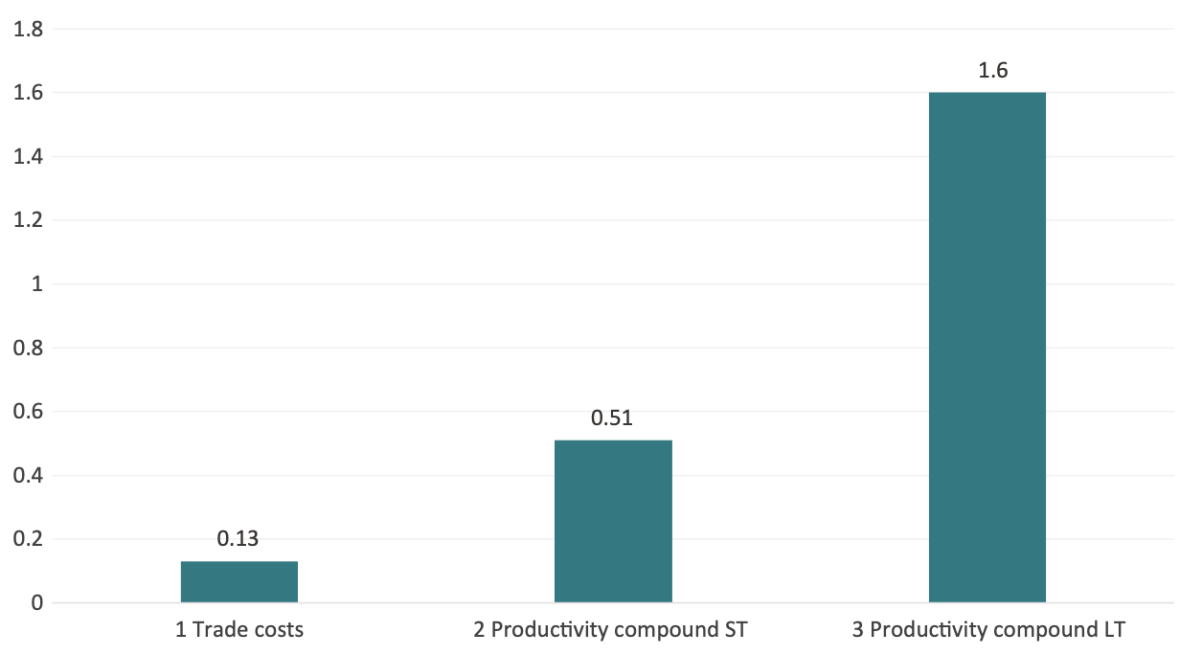
Source: ECIPE calculations.
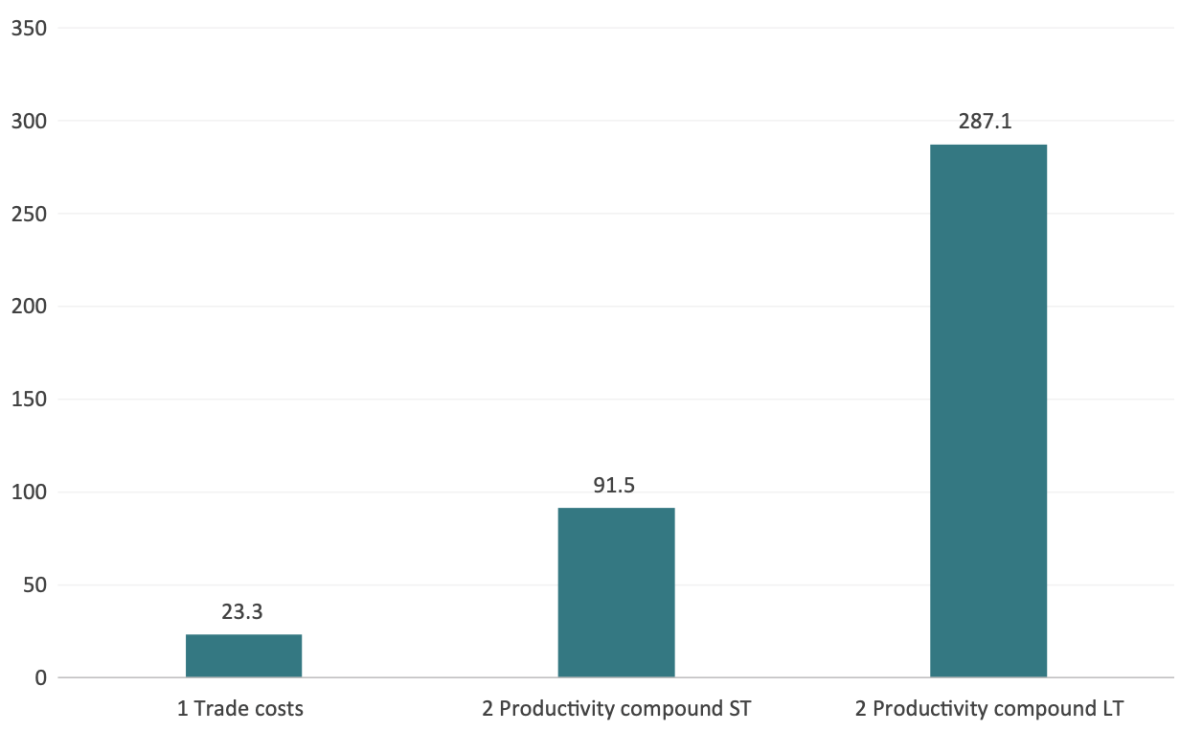
Considering an annual EU GDP of EUR 17.95 trillion in 2024, the trade costs scenario alone is estimated to result in gains of more than EUR 23 billion.49 Similarly, the long-term productivity scenario compounding both entry and conduct barrier reduction accounts for more than EUR 287 billion EUR. Estimated short-term gains for scenario 2 are relatively lower in comparison (see Figure 22).
These findings are significant. For example, the economic gains resulting from scenario 3 are a much higher value than the total allocation of EU investments to the recently proclaimed InvestAI initiative of the European Commission (EUR 200 billion)50 or could be used to significantly upgrade planned investments in EU AI factories (EUR 10 billion).51 The estimated gains are also higher than the value of total European defence spending in 2023 (EUR 279 billion) and amount to 88 percent of European defence spending in 2024 (EUR 326 billion).52
FIGURE 22: ESTIMATED INCREASE IN EUROPE’S GDP (IN BILLION EUROS)
 Source: ECIPE calculations.
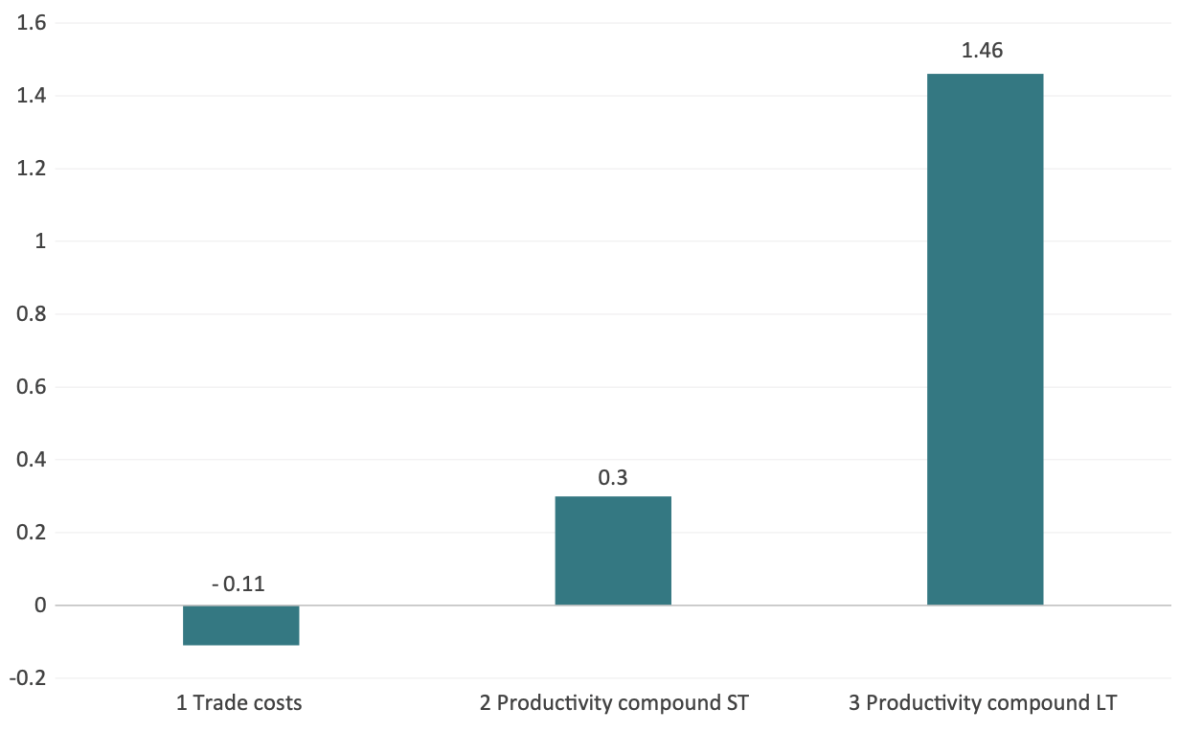
Figure 23 presents the estimation results in services output as a result of the macroeconomic shocks employed in the model. The results indicate that gains from productivity effects would be larger than those by trade costs, especially in the long-term scenario where they can unfold over the span of 5 years. Scenario 3 would amount to a 1.46 per cent increase in compound industry output in all EU services sectors which is also an indication of employment and welfare increases in the EU. Note that in scenario 1, services output actually slightly decreases, as the results suggests that domestic production is replaced by services imports from abroad. These negative effects are then offset in the other scenarios including increased productivity of firms in the EU services sectors.
FIGURE 23: ESTIMATED SERVICES OUTPUT INCREASE (IN PERCENTAGE TERMS)
 Source: ECIPE calculations.
These policy initiatives will impact on the number of jobs and the development of wages and salaries. While it is difficult to deduce labour market implications from the CGE modelling, a few potential impacts can be derived from estimated changes in services industry output. The rise of industry output in these scenarios would likely have a significant positive impact on private-sector employment and private-sector workers’ compensation, especially in these services sectors. The increase of productivity especially in services sectors is likely to trigger a reallocation of resources away from more inefficient sectors towards more efficient private-sector services sectors in the EU.
Depending on their economic impacts, each of the policy scenarios would also have an impact on consumers’ choices and available qualities in the EU. The scenarios would relatively increase competition from abroad. Firms abroad would face less barriers to enter the EU economy and domestic users – final consumers and business consumers – would have increased access to global supply.
The collective findings of this study present a compelling case for reimagining the EU’s industrial policy and focus policy reforms on services-led economic growth. Despite their dominant share of economic activity, employment, and productivity growth, services remain politically undervalued. Europe’s manufacturing-first policy mindset risks leaving untapped the growth potential inherent in dynamic, innovation-intensive service sectors – a potential that is in the hundreds of billions of euros every year in our best-case scenario.
To improve productivity and global competitiveness, the EU must pivot towards a modern growth strategy that reflects the realities of a servicified economy. A services-centred growth policy should be guided by the following principles:
Open and Market-Oriented Policy Framework
The EU must foster a competitive environment in which service firms can scale up, innovate, and lead globally. This entails reducing barriers to entry, encouraging cross-border service provision, and ensuring that regulatory and competition policies do not favour incumbents or specific sectors. Services thrive on market dynamism: high firm turnover, frequent employment reallocation, and rapid technological adoption are all critical features of a healthy service economy. Industrial policy must support – not stifle – this dynamism.
R&D-Led Innovation in Services
Europe’s innovation gap with the US is overwhelmingly a services R&D gap. Closing it requires a radical reallocation of public support and incentives. The EU should:
Dramatically incentivise private R&D in services, especially digital services and scientific research, through R&D tax incentives.
Pursue regulatory reforms that boost software, computer programming, and data-driven services.
Encourage collaboration between academia and services firms to scale up applied research.
Investment in Modern Endowments
Future competitiveness depends on Europe’s ability to accumulate the key intangible assets that underpin service-sector growth:
Human Capital: Support lifelong learning, digital skills development, and labour mobility within services sectors.
ICT Infrastructure: Expand digital connectivity and reduce disparities in infrastructure investment across Member States.
Intangibles: Promote policies that facilitate investment in intellectual property, organisational capital, and data capabilities.
This approach departs from traditional industrial strategies centred on manufacturing resurgence. Instead, it positions Europe to lead in the sectors that are already defining global economic success. Rebalancing policy support towards high-growth service activities is not only necessary for convergence with global innovation leaders – it is essential for creating jobs, boosting productivity, and ensuring long-term economic prosperity.
Description of the CGE model
In this study, CGE model simulations are conducted on the basis of the standard model by the Global Trade Analysis Project (GTAP) at the University of Purdue. CGE models are frequently used in economic impact assessments to estimate the magnitude of economic feedback effects, including structural changes in countries’ international trade profiles for goods and services (see, e.g., European Commission 2019; Brockmeier 1996).53
The model applied in this analysis is static-comparative and has been applied frequently in studies on the impacts of various trade policy measures such as tariffs and non-tariff trade barriers (NTBs). We apply a multi-regional and multi-sector model, characterized by perfect competition, constant returns to scale and a set of fixed Armington elasticities. The modelling is conducted on the basis of the default macro-closure, which applies a savings-driven model, i.e. the savings rate is exogenous and the investment rate will adjust.
As concerns the economic base data on which we run the simulations, we apply the most up-to-date GTAP 11 database released in 2023. The database contains global trade data for 2004, 2007, 2011, 2014 and 2017 as reference years based on input output tables and recorded trade protection data.54 The database covers 141 countries and 19 aggregate regions of the world for each reference year. The sectoral coverage includes a total of 65 sectors. The GTAP 11 dataset on the global economy was extrapolated to reflect the “best estimate” of the global economy today.
With regard to the regional set-up, we distinguish between the 27 EU member states (EU27) and the rest of the world (RoW) as one block each. The model’s sector aggregation is outlined in Table 4.
TABLE 4: GTAP SECTOR AGGREGATION
 Source: GTAP, ECIPE.
Key assumptions of the CGE model
CGE simulation results are sensitive to various features of the model and assumptions underlying of the modelling approach, incl. the quality of the underlying trade and production data, the underlying closure (the parameterization of casual economic relationships), and the actual quantification of economic shocks (e.g. the level of numerical tariff equivalents of non-tariff trade barriers). The outcomes in terms of changes in economic variables also depend on the set-up of the model and the assumptions underlying the modelling approach which translates real world legal obligations to quantitative inputs for the model. These include assumptions about the nature of competition, substitutability of goods and services, trade elasticities, scale economies, firm heterogeneity and productivity, which are frequently subject to criticism in academic and policy circles.
Like any applied economic model, the model used in this analysis is based on a number of assumptions which simplify complex behavioral economic relationships and the policy framework governing the reality of domestic production and international commerce. The results of the estimations therefore only have indicative character as it is not possible to forecast the precise economic impacts of regulatory changes on macro-economic variables, mainly due to lack of empirical data, the influence of a many different policy and non-policy factors and causal relationships that change over time (Lucas critique).55 In the following, we outline key assumptions and their implications for the modelling of the scenarios and the interpretation of the modelling results.
The applied model is comparative-static, i.e. the simulation results reflect two equilibria at different points in time.56 As concerns the timeframe for the economic impacts to evolve, the time horizon generally depends on the nature of the simulated policy shock and a reasonable assessment of agents’ behavioral responses, i.e. adjustments in consumption, production, trade and investment. The timeframe also depends on the nature of the policy change and is generally sensitive to industry characteristics. The timeframe for economic impacts to unfold thus needs to be assessed and discussed on a sector-by-sector basis. In addition, the assumption of full factor mobility and full employment of factors of production, i.e. all factors of production including labor will adjust until they are fully absorbed by other sectors after the policy changes, has critical implications for the modelling and the assessment of the time horizon within which policy-induced economic impacts will unfold.
Effects on domestic productivity
Effects on productivity are studied in addition to the impacts that result from the other scenarios. Due to the comparative-static nature of the applied CGE model, the results derived from data-induced AVEs do not include any effects on total factor productivity over time in the EU’s economy. However, productivity gains would likely accrue after the imposition of the new policies as a result of higher quantities available or better access to productive technologies and innovation at the technology frontier. To varying extents, productivity gains are likely to prevail over the medium to longer term. For each of the productivity simulation sets, productivity gains are estimated on the basis of percentage increases in output of productive technologies and total factor productivity estimates derived by Gal et al. (2019). Gal et al. assess how the adoption of a variety of technologies impacts on firm-level productivity. Based on varying specifications of econometric models, it is estimated for a set of EU countries that increases in the adoption of certain technologies (and respective business models) by firms translate into total factor productivity (TFP) changes. For example, the estimations indicate that a 10-percentage point increase in adoption of productive technologies such as high-speed broadband or cloud computing would translate into an instantaneous increase in MFP growth by 0.9 percentage points. After 5 years, this would imply a 3.5 percentage points higher TFP level for the average firm.57 In order to arrive at our productivity shocks, we multiply the coefficient gains of 1.39 percent (reduction of entry barriers), 1.59 percent (reduction of conduct barriers) and 2.8 percent (reduction of both entry and conduct barriers) obtained by van der Marel et al. (2016) by 0.9 percentage points for the short-term productivity scenarios, and by 3.5 percentage points for the long-term productivity scenarios. As a background for our analysis, note that we have also performed modelling calculations that break down the assumed reduction of overall regulatory restrictions into a reduction of either entry or conduct barriers alone. As can be expected from the coefficients, we have found that reductions in behind-the-border conduct barriers have a greater economic impact than reductions in entry barriers.
World Bank World Development Indicators (WDI). A total of 216 countries were analysed of which 145 had a services value added in % of GDP greater than 50 percent.
Ibid.
Rodrik D. (2016). This outcome is also labeled as premature deindustrialization, which captures the extent to which lower-income countries move into services sooner than currently developed economies and at lower levels of development. Even though the literature is concerned that this offers lower-income countries less opportunities to generate higher levels of development, measured by GDP per capita, an increasing set of literature recognized that the services economy offers an alternative path to increased prosperity for these countries. See, for instance, Nayyar et al. (2021).
Our World in Data (2016): https://ourworldindata.org/grapher/gdp-vs-services-gdp
The Economist (2024, June 24) Will services make the world rich?: https://www.economist.com/finance-and-economics/2024/06/24/will-services-make-the-world-rich
Sirilli, G. and Evangelista, R. (1998). Technological innovation in services and manufacturing: Results from Italian surveys.Research Policy, 27(9), pp. 881–899. https://doi.org/10.1016/S0048-7333(98)00084-5
Burdeau, C. (2025, January 23). Trump tells Davos elites tariffs will make US a ‘manufacturing superpower’. Courthouse News Service. https://www.courthousenews.com/trump-tells-davos-elites-tariffs-will-make-us-a-manufacturing-superpower/
Élysée. (2024, April 25). Europe speech. https://www.elysee.fr/en/emmanuel-macron/2024/04/24/europe-speech
European Commission. (2025, February 26). A Clean Industrial Deal for competitiveness and decarbonisation in the EU. Press release. https://ec.europa.eu/commission/presscorner/detail/en/ip_25_550
Draghi, M. (2024). The future of European competitiveness – Part A | A competitiveness strategy for Europe (External Government Report), p. 10. Brussels: European Commission. https://commission.europa.eu/document/download/97e481fd-2dc3-412d-be4c-f152a8232961_en?filename=The%20future%20of%20European%20competitiveness%20_%20A%20competitiveness%20strategy%20for%20Europe.pdf
Glass, A. and Madland, D. (2024, March 6). Communities that lost manufacturing jobs are main beneficiaries of Biden administration’s new industrial policy. Center for American Progress. https://www.americanprogress.org/article/communities-that-lost-manufacturing-jobs-are-main-beneficiaries-of-biden-administrations-new-industrial-policy/
The data available through the State Aid Transparency Public Search does not capture the full scope of all state aid measures authorised by the European Commission, but rather represents only a subset of the total. Nonetheless, it provides a valuable indication of how state aid is distributed across different economic sectors. See: European Commission. State Aid Transparency Public Search. https://webgate.ec.europa.eu/competition/transparency/public?lang=en
Van der Marel, E., Erixon, F., Guinea, O. and Lamprecht, P. (2020). Are services sick? How going digital can cure services performance. Bertelsmann Stiftung. See also https://www.bertelsmann-stiftung.de/en/publications/publication/did/are-services-sick
Erixon, F., Guinea, O. and du Roy, O. (2024). Keeping up with the US: Why Europe’s productivity is falling behind. ECIPE Policy Briefs. https://ecipe.org/publications/keeping-up-with-the-us-why-europes-productivity-is-falling-behind/
Erixon, F., Guinea, O. and du Roy, O. (2024). Keeping up with the US: Why Europe’s productivity is falling behind. ECIPE Policy Briefs. https://ecipe.org/publications/keeping-up-with-the-us-why-europes-productivity-is-falling-behind/
Criscuolo, C., P. Gal and C. Menon. (2014). The Dynamics of Employment Growth: New Evidence from 18 Countries. OECD Science, Technology and Industry Policy Papers, No. 14. OECD Publishing: Paris. https://doi.org/10.1787/5jz417hj6hg6-en
Due to availability reasons in the EU KLEMS data, countries only include Austria, Belgium, Germany, Estonia, France, Italy, Netherlands, Luxembourg, Portugal, and Finland.
World Bank. (2023). GDP (constant 2015 US$). https://data.worldbank.org/indicator/NY.GDP.MKTP.KD
Bloom, N., Jones, C. I., Van Reenen, J. and Webb, M. (2020). Are Ideas Getting Harder to Find?. American Economic Review, American Economic Association, 110(4), pp. 1104–1144.
Using linear regression on data from 2003 to 2023, AI estimated the year in which industry and services R&D spending would each account for 50 per cent of the total. The projected crossover point is approximately 2050.63, rounding to the year 2051.
See, for instance, Miroudot, S. and C. Cadestin (2017-03-15), “Services in Global Value Chains: From Inputs to Value-Creating Activities”, OECD Trade Policy Papers, No. 197, OECD Publishing, Paris
European Commission, Joint Research Centre, Nindl, E., Napolitano, L., Confraria, H., Rentocchini, F., Fako, P., Gavigan, J. and Tübke, A. (2024, December 18). The 2024 EU Industrial R&D Investment Scoreboard – Scoreboard panel 2003–2023. https://iri.jrc.ec.europa.eu/sites/default/files/contentype/scoreboard/2025-02/Scoreboard_panel_2024.xlsx
See, for instance, Corrado, C., J. Haskel, C. Jona-Lasinio, and M. Iommi (2016) “Intangible Investment in the EU and US before and since the Great Recession”. Chapter 2 (pp. 73-101) in Investment and Investment Finance in Europe 2016. Luxembourg: Economics Department, European Investment Bank (November)
Brynjolfsson, E., D. Rock, and C. Syverson (2021) “The Productivity J-Curve: How Intangibles Complement General Purpose Technologies.” American Economic Journal: Macroeconomics 13 (1): 333–72
Bagna, E., Cotta Ramusino, E., and Denicolai, S. (2021). Innovation through patents and intangible assets: Effects on growth and profitability of European companies. Journal of Open Innovation: Technology, Market, and Complexity, 7(4), 220. https://doi.org/10.3390/joitmc7040220
Bontadini, F., Corrado, C., Haskel, J., Iommi, M. and Jona-Lasinio, C. (2023). EUKLEMS & INTANProd: Industry productivity accounts with intangibles – Sources of growth and productivity trends: Methods and main measurement challenges. https://euklems-intanprod-llee.luiss.it/download/
Anderson, J.E., I. Borchert, A. Mattoo, and Y. Yotov (2018) “Dark costs, missing data: Shedding some light on services trade,” European Economic Review, Elsevier, vol. 105(C), pages 193-214.
Cernat, L., Díaz Mora, C. and Guinea, O. (2024). The external side of Europe’s great economic transformation: International trade in services. ECIPE Policy Briefs. https://ecipe.org/publications/europe-great-economic-transformation-international-trade-in-services/
Van der Marel, E., Erixon, F., Guinea, O. and Lamprecht, P. (2020). Are services sick? How going digital can cure services performance. Bertelsmann Stiftung. https://www.bertelsmann-stiftung.de/en/publications/publication/did/are-services-sick
Worstall, T. (2016, March 29). Services, not manufacturing, make America rich. Forbes. https://www.forbes.com/sites/timworstall/2016/03/29/services-not-manufacturing-make-america-rich/
Draghi, M. (2024). The future of European competitiveness – Part A | A competitiveness strategy for Europe (External Government Report), p. 23. Brussels: European Commission. https://commission.europa.eu/document/download/97e481fd-2dc3-412d-be4c-f152a8232961_en?filename=The%20future%20of%20European%20competitiveness%20_%20A%20competitiveness%20strategy%20for%20Europe.pdf
Bontadini, F., Corrado, C., Haskel, J., Iommi, M. and Jona-Lasinio, C. (2023). EUKLEMS & INTANProd: Industry productivity accounts with intangibles – Sources of growth and productivity trends: Methods and main measurement challenges. https://euklems-intanprod-llee.luiss.it/download/
Erixon, F., Guinea, O. and du Roy, O. (2024, May). Keeping up with the US: Why Europe’s productivity is falling behind. ECIPE Policy Briefs. https://ecipe.org/publications/keeping-up-with-the-us-why-europes-productivity-is-falling-behind/
Dugo, A. (2024, October). South Korea Versus Japan: What Can the EU Learn From the Two Countries?. ECIPE Blog. https://ecipe.org/blog/south-korea-japan-what-can-eu-learn/
Dugo, A. (2024, December). Sweden vs Switzerland: A Heavyweight Champions Fight on Innovation. ECIPE Blog. https://ecipe.org/blog/sweden-vs-switzerland-champions-fight-on-innovation/
Abdi, I., Dugo, A., Erixon, F. and Tähtinen, L. (2025, March). The 8 percent approach: A big bang in resources and capacity for Europe’s economy and defence. ECIPE Occasional Papers. https://ecipe.org/publications/big-bang-resources-capacity-eu-economy-defence/
Dugo, A. (2024, July). Europe vs United States – Boosting Competition in Space and the Skies. ECIPE Blog. https://ecipe.org/blog/sweden-vs-switzerland-champions-fight-on-innovation/
European Commission, Joint Research Centre, Nindl, E., Napolitano, L., Confraria, H., Rentocchini, F., Fako, P., Gavigan, J. and Tübke, A. (2024, December 18). The 2024 EU Industrial R&D Investment Scoreboard – Scoreboard panel 2003–2023. https://iri.jrc.ec.europa.eu/sites/default/files/contentype/scoreboard/2025-02/Scoreboard_panel_2024.xlsx
Fuest, C., Gros, D., Mengel, P.-L., Presidente, G. and Tirole, G. (2024, April). EU innovation policy – How to escape the middle technology trap?. EconPol Policy Report. Institute for European Policymaking at Università Bocconi. https://iep.unibocconi.eu/sites/default/files/media/attach/2Report_EU%20Innovation%20Policy_upd_240514.pdf
Mårten Blix (2023). Wither on the Vine? The Unfulfilled Single Marker for Services. Almega.
Chinchih Chen, Carl Benedikt Frey and Giorgio Presidente (2022). Privacy Regulation and Firm Performance: Estimating the GDPR Effect Globally. Oxford Martin School Working Papers, No. 01-2022.
IMF (2024). Europe’s Declining Productivity Growth: Diagnoses and Remedies. Regional Economic Outlook Notes: Europe.
OECD (2025). New Evidence on the Effects of Services Trade at the Worker Level. OECD Trade Policy Papers No. 290.
Erik van der Marel and Martina Ferracane (2021). Do Data Policy Restrictions Inhibit Trade in Services? Review of World Economics, vol. 157:4.
IMF (2024). Europe’s Declining Productivity Growth: Diagnoses and Remedies. Regional Economic Outlook Notes. Note Based on year 2020 from IMF data, see figure 1.2.2, p.18. Available at: https://www.imf.org/en/Publications/REO/EU/Issues/2024/10/24/regional-economic-outlook-Europe-october-2024
Entry barriers are regulatory hurdles that a company faces when entering a foreign market, which therefore can be seen as market access berries. Conduct regulations are regulatory policies that firms face after entering a foreign market and affect the operations of the firm. They can be roughly considered as non-discriminate behind-the-border barriers.
Van der Marel, E., J. Kren, and M. Iootty (2016) “Services in the European Union: What Kinds of Regulatory Policies Enhance Productivity?” World Bank Policy Research Working Paper No. 7919, World Bank, Washington DC. Available at: https://openknowledge.worldbank.org/server/api/core/bitstreams/b0c4d5a8-ef74-582f-9f8d-3b66024e86bf/content
Gal et al. (2019). Digitalization and productivity: In search of the holy grail – Firm-level empirical evidence from EU countries. OECD Economics Department Working Papers No. 1533, OECD Publication, Paris. Available at: https://www.oecd.org/en/publications/digitalisation-and-productivity-in-search-of-the-holy-grail-firm-level-empirical-evidence-from-eu-countries_5080f4b6-en.html
Eurostat (2025). GDP and main components (output, expenditure and income). Available at: https://ec.europa.eu/eurostat/databrowser/view/NAMQ_10_GDP__custom_5066897/default/table?lang=en (Accessed on 23.04.2025).
Euroepan Commission (2025). EU launches InvestAI initiative to mobilise €200 billion of investment in artificial intelligence. Available at: https://ec.europa.eu/commission/presscorner/detail/en/ip_25_467
European Parliament (2025). AI Factories. Briefing. Available at: https://www.europarl.europa.eu/RegData/etudes/BRIE/2025/769492/EPRS_BRI(2025)769492_EN.pdf
European Defence Agency (2025). EU defence spending hits new records in 2023, 2024. Available at: https://eda.europa.eu/news-and-events/news/2024/12/04/eu-defence-spending-hits-new-records-in-2023-2024
A substantial number of economic impact assessments of EU free trade agreements (FTAs) and economic partnership agreements are carried out or accompanied by CGE models, which are the state of the art for comprehensive assessments of policy changes at regional and sector level (see, e.g., European Commission 2016).
It is built on the most reliable international data sources (including Eurostat data for EU countries) and undergoes constant scrutiny by the different stakeholders and users such as the European Commission, the World Bank, OECD, IMF, WTO, United Nations, FAO, etc.
The Lucas critique is a criticism of econometric policy assessment approaches that fail to recognize that optimal decision rules of economic agents vary systematically with changes in regulation. It criticizes using estimated statistical relationships from past data to forecast the effects of adopting a new policy, because the estimated regression coefficients are not invariant but will change along with agents’ decision rules in response to a new policy context.
Most CGE models are “comparative-static” by default, i.e. the results of the modelling to not have a preset time dimension indicating how long it would take the economy to adjust to a new equilibrium.
The effect after 5 years results from accumulated annual increases in MFP growth combined with weaker catch-up due to progressively higher MFP levels.