Data tools used: www.plotset.com
Original source https://www.nationwide.co.uk/media/hpi/
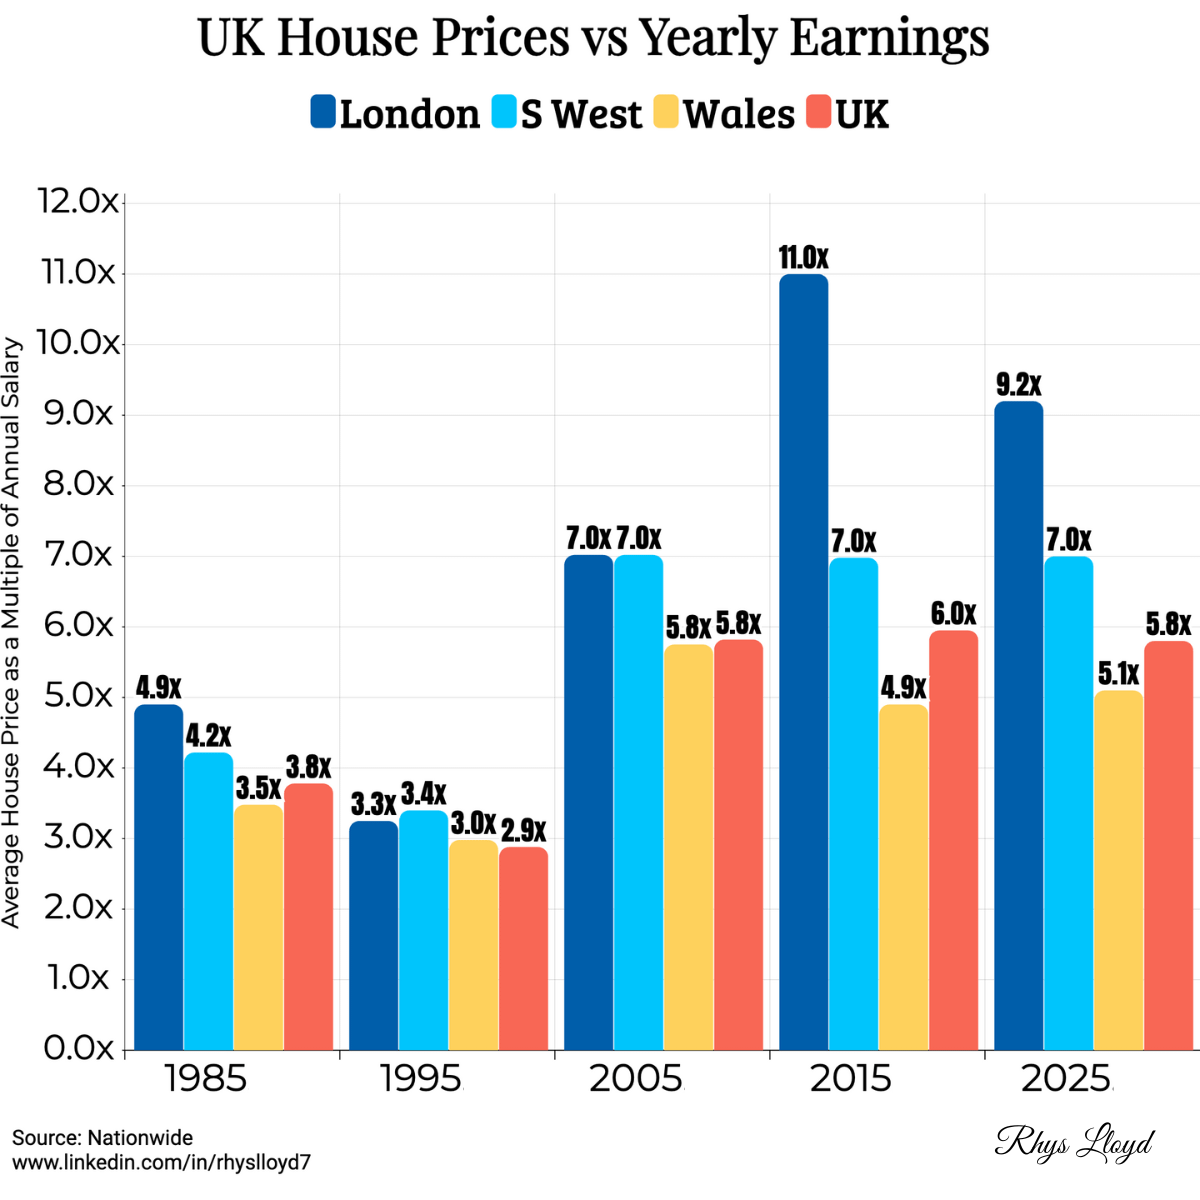
Description: Average UK house price to annual earnings
Posted by rhyslloyd7
![[OC] UK House Prices vs Yearly Earnings](https://www.europesays.com/wp-content/uploads/2025/12/34nrj3d76s4g1-1200x1024.png)
Data tools used: www.plotset.com
Original source https://www.nationwide.co.uk/media/hpi/
Description: Average UK house price to annual earnings
Posted by rhyslloyd7
10 comments
Nice graph, even though the data is not beautiful.
Why did you decide for a bar graph and not a line graph?
I’ll be honest, I expected more of an upward trend than that
Calling Wales regional is bold
I’d like to know which average is being used… median would be best..
At this rate people will stay with their partents into their mid 40s
The problem is, those ratios never take into account interest rates. That is the REAL issue with affordability. A ratio of 5x can be way more affordable than 4x if interest rates are lower.
Please correct me if I’m wrong, but these are house prices not values i.e. what is on the market or sold? Might be nice to make sure that is clear.
It would also be great to see some other plots or overlays. Interest rate and sales volumes have a big impact on these numbers. One could be added as a line to this graph without being too messy.
Also would be good (if you had the data) to standardise for property type. Number of bedrooms or flats vs houses. Stock available and what is selling really skews this. For example, if housing becomes less affordable, only more affluent people can buy so the average of what is sold goes up.
Interesting graph. Thanks for sharing.
If anyone is wondering why its because from the mid 90’s the central bank deregulated private banks, and they went on to print masses of £’s, which in turn caused an asset price spike, and subsequent financial crisis. The country then reelected the same political party that caused the spike, and they deliberately kept prices high. This is why we are where we are. It’s a common problem that we’ve seen in several countries, and it can all be traced to the deregulation of financial institutions by the government / central bank.
London, South West, Wales – the three UK regions.
Would love to see prices from Northern Ireland included in this as well, there’s been a big increase in prices in Northern Ireland the past 10 years or so
Comments are closed.