
Morningstar (MORN) just gave income focused investors something to chew on, announcing a 10% boost to its quarterly dividend, lifting the payout to 50 cents per share starting with the January distribution.
See our latest analysis for Morningstar.
Even with the dividend bump and recent product updates to its Medalist Rating, Morningstar’s share price at $218.21 reflects a year to date share price return of roughly negative mid thirties, and a one year total shareholder return in the high negative thirties. This suggests that while sentiment has been weak, investors may be starting to reassess the risk reward as margins stabilize.
If this dividend move has you rethinking where you hunt for returns, it could be a good moment to broaden your search and explore fast growing stocks with high insider ownership.
With the stock down sharply even as revenue and earnings creep higher, pessimism looks entrenched while analyst targets still sit meaningfully above today’s price. Is Morningstar quietly undervalued or already discounting a robust growth rebound?
Price-to-Earnings of 23.9x: Is it justified?
On a price-to-earnings basis, Morningstar trades at 23.9 times earnings, which leaves the stock looking relatively fully priced despite its recent share price slide.
The price-to-earnings ratio compares the share price to the company’s earnings per share and is a common way to gauge how much investors are paying for each dollar of profit. For a mature but still growing capital markets data and analytics business like Morningstar, this multiple also reflects expectations for continued earnings expansion and the durability of its fee based, information driven model.
Against that backdrop, the current 23.9 times multiple is a mixed signal. It looks reasonable to slightly cheap when lined up against both the wider US capital markets industry on 24.2 times and a peer average of 27.5 times, hinting that the market is not assuming aggressive profit growth. However, when set beside an estimated fair price to earnings ratio of 14.2 times from our regression based fair ratio work, the stock screens as materially expensive, implying the market is still paying up for Morningstar’s quality, margins and strong return on equity profile.
Compared with the broader industry’s 24.2 times and peers on 27.5 times, Morningstar’s 23.9 times looks modest on a relative basis, but sharply richer than the 14.2 times level our fair ratio suggests the market could ultimately gravitate toward if sentiment normalises around more subdued growth assumptions. Explore the SWS fair ratio for Morningstar
Result: Price-to-earnings of 23.9x (OVERVALUED)
However, persistent share price weakness or a sharper slowdown in revenue growth could signal deeper competitive pressures and challenge expectations for a smooth margin recovery.
Find out about the key risks to this Morningstar narrative.
Another View: DCF Flags a Very Different Story
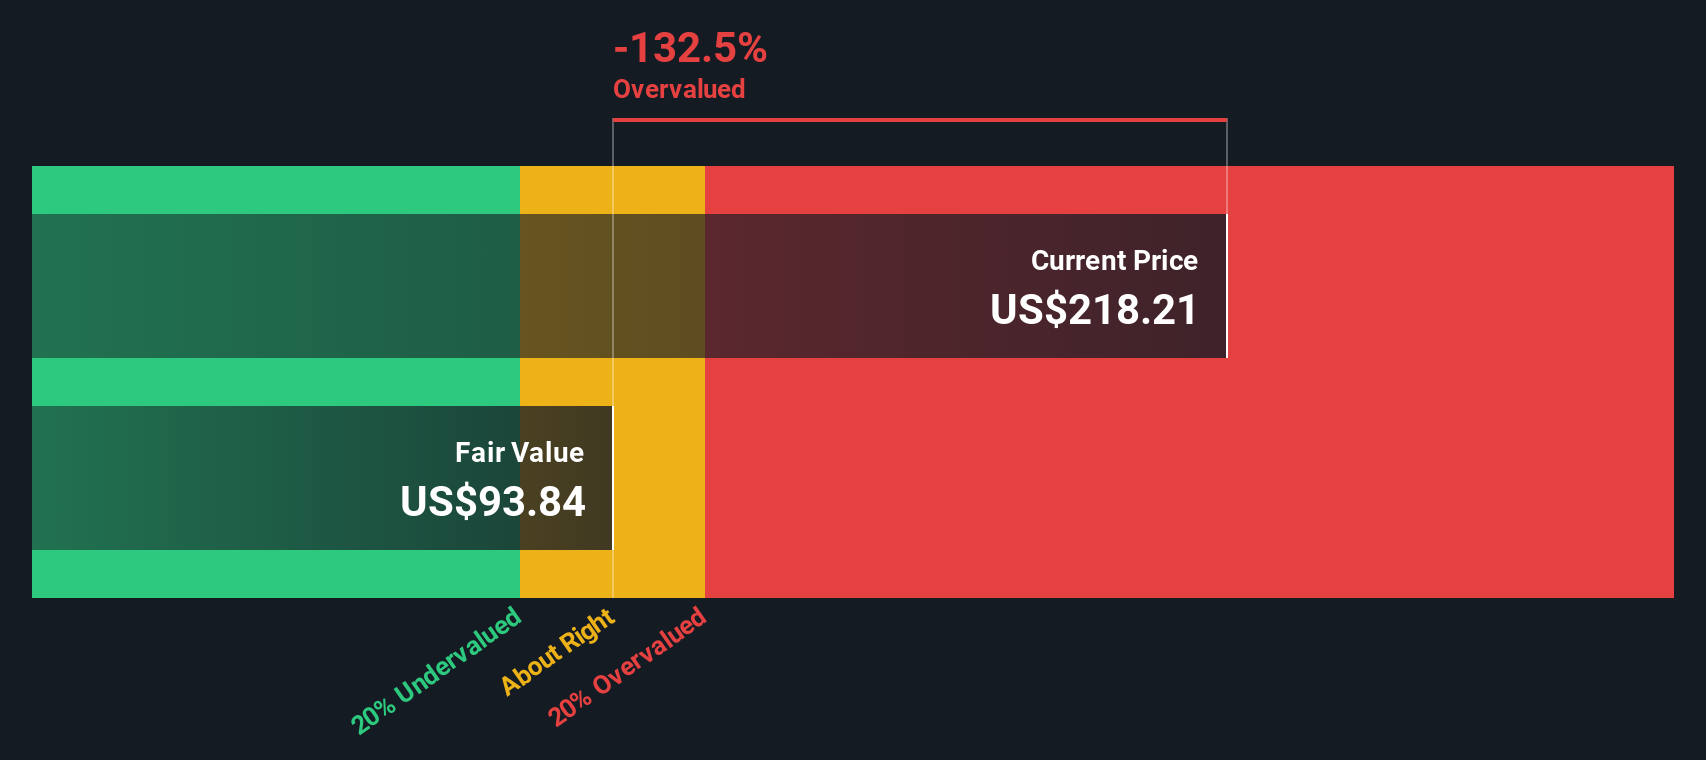
Our DCF model paints a much harsher picture, putting Morningstar’s fair value near $93.84, well below the current $218.21 share price. On that math, the stock looks significantly overvalued and raises the question of which lens investors should trust when expectations reset.
Look into how the SWS DCF model arrives at its fair value.
 MORN Discounted Cash Flow as at Dec 2025
Simply Wall St performs a discounted cash flow (DCF) on every stock in the world every day (check out Morningstar for example). We show the entire calculation in full. You can track the result in your watchlist or portfolio and be alerted when this changes, or use our stock screener to discover 907 undervalued stocks based on their cash flows. If you save a screener we even alert you when new companies match – so you never miss a potential opportunity.
Build Your Own Morningstar Narrative
If you see the story differently, or want to dig into the numbers yourself, you can build a personalised view in just a few minutes: Do it your way.
A good starting point is our analysis highlighting 4 key rewards investors are optimistic about regarding Morningstar.
Ready for more investment ideas?
Do not stop at a single opportunity when a world of potential is one click away. Use the Simply Wall Street Screener to explore additional possibilities.
This article by Simply Wall St is general in nature. We provide commentary based on historical data
and analyst forecasts only using an unbiased methodology and our articles are not intended to be financial advice. It does not constitute a recommendation to buy or sell any stock, and does not take account of your objectives, or your
financial situation. We aim to bring you long-term focused analysis driven by fundamental data.
Note that our analysis may not factor in the latest price-sensitive company announcements or qualitative material.
Simply Wall St has no position in any stocks mentioned.
We’ve created the ultimate portfolio companion for stock investors, and it’s free.
• Connect an unlimited number of Portfolios and see your total in one currency
• Be alerted to new Warning Signs or Risks via email or mobile
• Track the Fair Value of your stocks
Have feedback on this article? Concerned about the content? Get in touch with us directly. Alternatively, email editorial-team@simplywallst.com