![[OC] How Netflix Turned $11.1B in Revenue into $3.1B Profit in Q2 FY25](https://www.europesays.com/wp-content/uploads/2025/12/uh6yt8cbzc7g1-1920x1024.png)
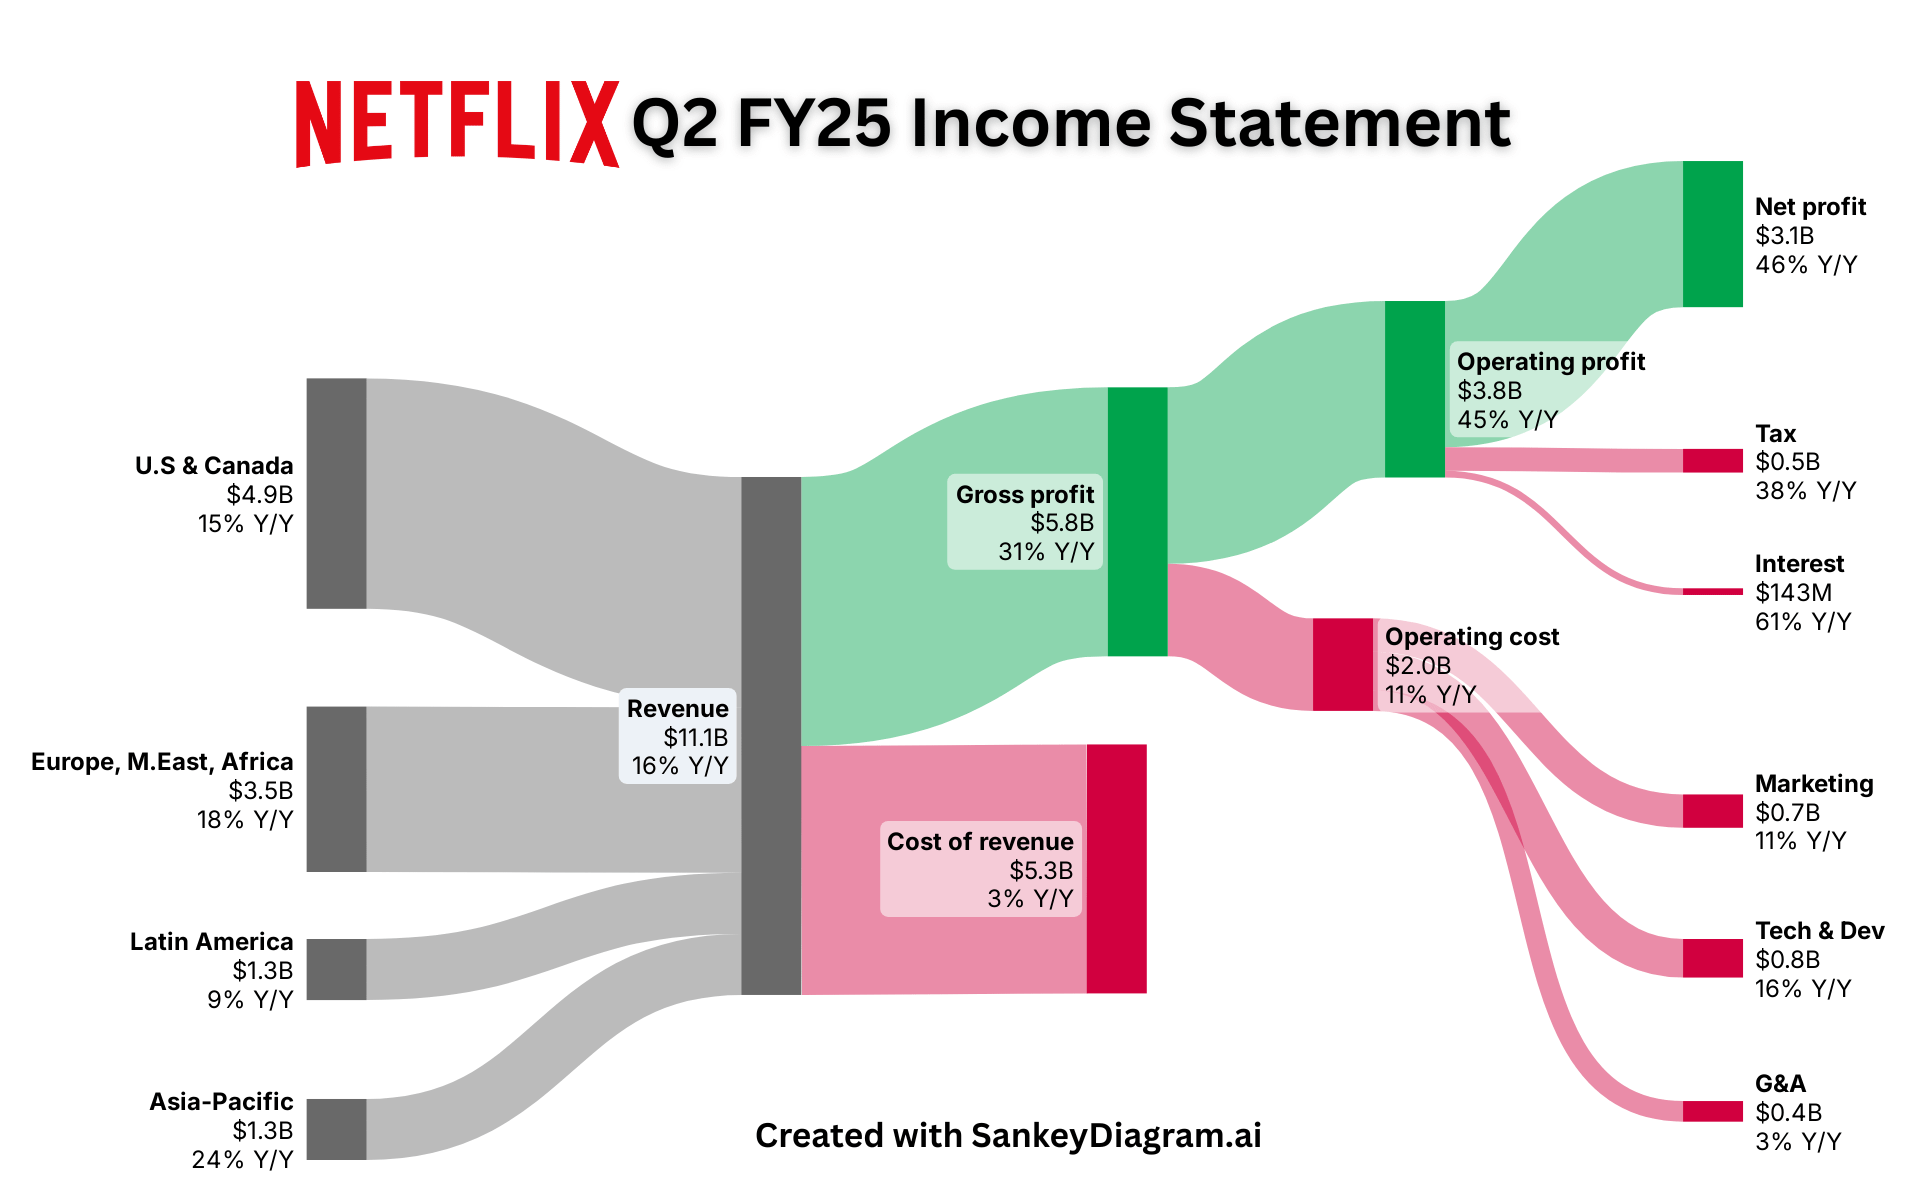
This Sankey diagram depicts Netflix's Q2 FY25's financial statement which shows the way $11.1B in revenues across different regions is channeled through cost and operating expenses, in order to generate $3.1B of net profits (+46% YoY).
Produced using: SankeyDiagram + Illustrator
source: Netflix Q2 FY25 earnings report (Investor Relations)
Posted by FrostingTall9171
3 comments
I wish I had a 16% tax rate..
How is the tax that little? Owners are always bitching about how the government takes half and that’s like one eighth
There’s nothing beautiful or interesting about a sankey diagram in 2025 – it represents the absolute minimum effort version of an r/dataisbeautiful post.
Comments are closed.