The 59% of 45-54 year olds with less than $50,000 saved for retirement are ngmi
Why exclude data for sample size concerns when there is no identifying information included in this chart?
Someone needs to make a PSA for /r/personalfinance
Makes sense that younger people have less savings, but it would be interesting to see each generations savings at a specific age.
This is a scary graphic…I don’t feel like I am adequately prepared for retirement and i’m in the top 20% for my age group…
Quite surprised how large the $0 is.
Recently hit $1m and only 6% of my age category has this.
This looks suspiciously incorrect.
53% if 65+ have saved $0 for retirement. I’d like to know the definitions of some words and the methodology for determining this.
Maybe I’m not understanding this graph, but does the Boomer+ demo having the largest $0 proportion mean that, right now, half of that cohort have exhausted whatever savings they might have had, or does it mean they never had the savings? If the former, I’m not sure this graph is particularly helpful.
The older group had pensions. I doubt those are looked at the same as 401ks or IRAs and might explain some of the gap there.
And this is why welfare exists! No one should be going hungry or cold, especially those who can’t work anymore.
Half under 35 at 0 is fucking crazy. I’m behind by traditional advice but the top 5% in the age group. Only possible given my high income (lady luck smiled on me half a decade ago). Even if a significant portion forgoed retirement savings to buy a house now, that is a hell of a bet on real estate value.
I mean, this seems like a catastrophe waiting in the deep.
I’d like to see this as a life table, corrected for age.
Of course young people, who have more earning time and more compound-interest time ahead of them, “should” have less saved than old ones. But how were today’s 50-yos doing when they were 20?
My buddy (married, family of 4, his wife is SAHM, so single income, no extravagant expenses, does travel internationally to wife’s home country but mostly on miles) has over $3m (excluding home equity) at 55 and it’s not even close to what his financial advisor says he needs to continue living in a high COL area.
TIL I’m in the top group for my age bracket. let’s go
Scary how big that $0 group is
They took out some wealthier households because of sample size concerns? that seems a bit like putting your thumb on the scale.
also, I think looking at only retirement accounts is a bit misleading since there are plenty of people who have tons of home equity value who will likely sell and move somewhere smaller and cheaper when they retire.
(I believe the decline in home values that we are seeing is going to be the thing that indirectly causes a deep recession. even if most people have low mortgage payments, they are going to cut back on spending if the see the value of their home decline and know that they need to start saving more for retirement. there will be a cascade effect from lowering home prices.)
The report calls out it does not include DB pension which was standard until like 20 years ago. So older age groups should all increase while little effect on youngest age group.
Edit: Also not included are home equity, investment accounts or even checking accounts. The data only includes IRA and DC plans. Only calling out DB as it is also a main source of retirement income.
I know shit’s fucked, but that 0 range seems incredibly high.
Is this per household or individual? And I feel like the sample size must be absolute garbage if under 35 with >250K doesn’t even make the chart.
Thumbnail looks like Brazil.
The problem with this graph is that it does not take in what previous generations did at that age. Granted the 401k and IRAs were created in the 1970s but people were saving money for retirement for hundreds of years.
I look at squirrels and think why humans cant be like them. Instant gratification must be a human problem.
So millennials onwards are fucked?
This doesn’t include 401k ? Just Ira?
The method is still unclear. Suppose a married couple have individual IRA accounts with one four times the amount in the other’s. Did they get averaged? Counted as one having above a million and the other less than 100K? It could misrepresent the household numbers.
I was doing great until I had a medical emergency and insurance refused to cover anything so I had to liquidate my entire 401k to pay medical bills 🫠
Those over 65 actually are less likely to have more than a million in savings than those 60 years old?
I think we might need to break 65+ into multiple brackets:
65-74, 75-84, 85+
I’m curious if the retirees have spent down their savings money or if they never had it to begin with
Ooof. So like over half of the populations retirement will be like an extended vacation then back to work?
And they wonder why no one is having kids.
Not too meaningful, since Americans save mostly through real estate. If you have a paid-off house and social security, a small IRA balance isn’t the end of the world. Harder to buy that house for younger generations of course.
Crazy that despite living in a world of material and financial abundance where we’ve made tremendous gains in our productivity, we still work people to the day they die like we’re living in 1407. All to make a small handful of blokes even richer. Absolute backwaters of countries we live in.
This is terrifying. This is why financial literacy needs to be taught in schools from a young age.
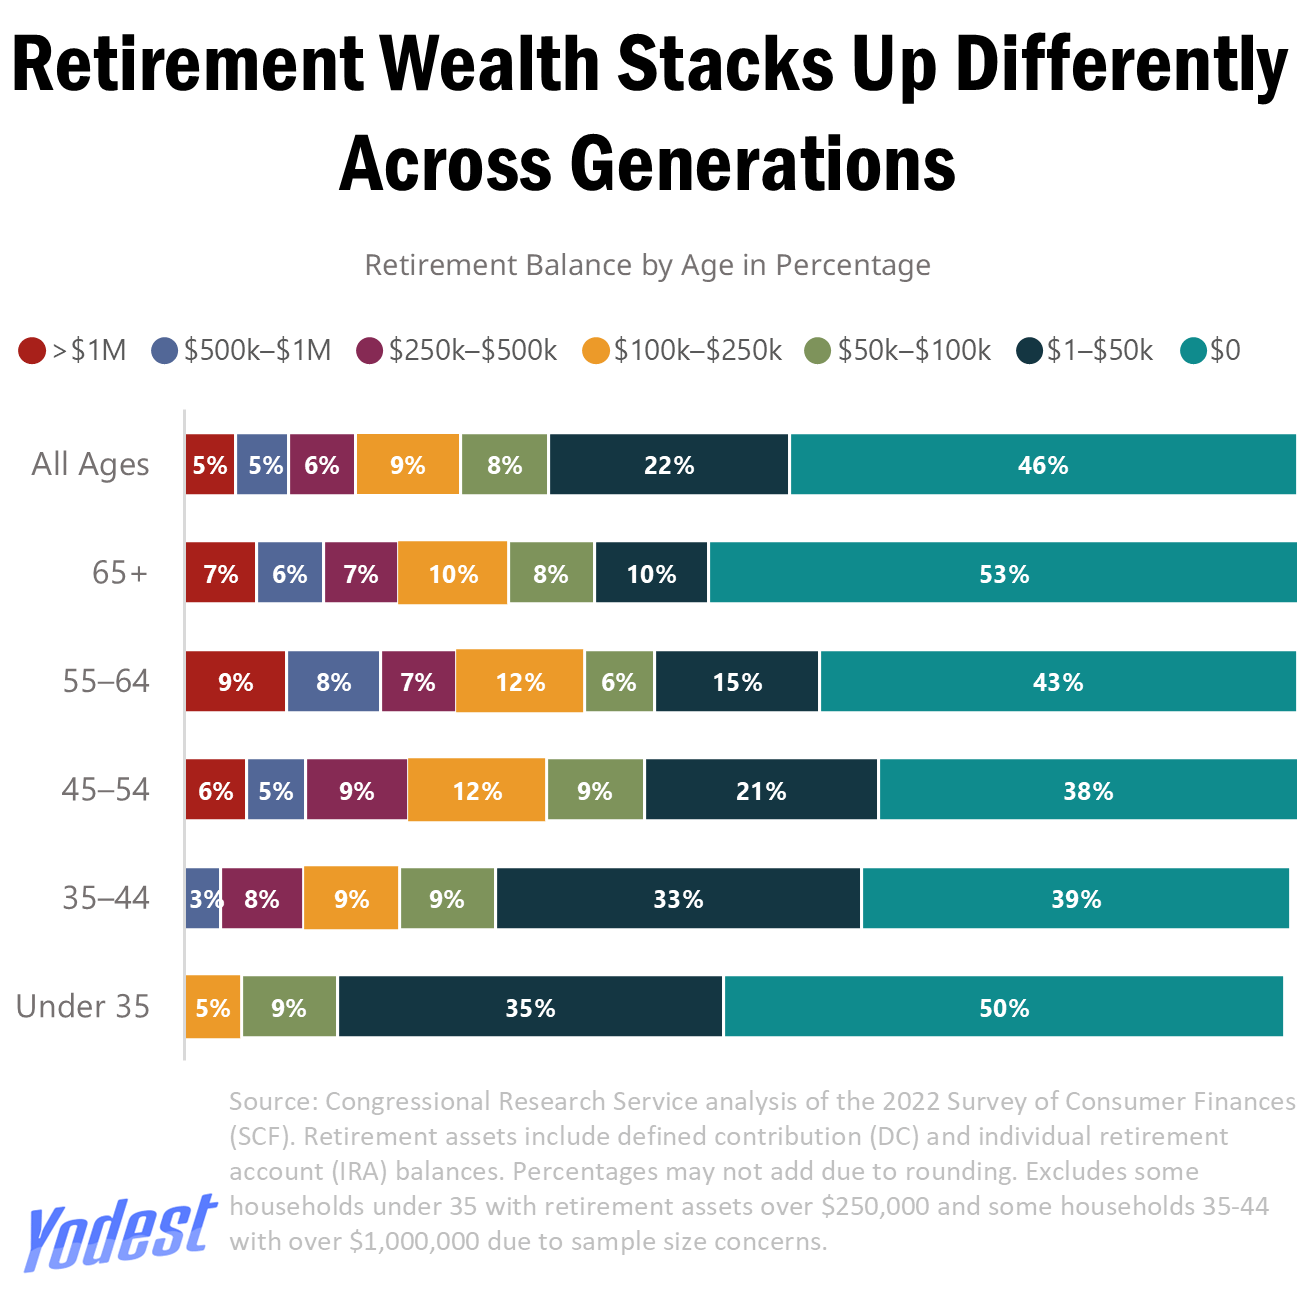
![[OC] How Much Has An Average American Saved Up For Retirement - By Age/Generation](https://www.europesays.com/wp-content/uploads/2025/12/vbqj0t6lme7g1-1299x1024.png)
31 comments
The 59% of 45-54 year olds with less than $50,000 saved for retirement are ngmi
Why exclude data for sample size concerns when there is no identifying information included in this chart?
Someone needs to make a PSA for /r/personalfinance
Makes sense that younger people have less savings, but it would be interesting to see each generations savings at a specific age.
This is a scary graphic…I don’t feel like I am adequately prepared for retirement and i’m in the top 20% for my age group…
Quite surprised how large the $0 is.
Recently hit $1m and only 6% of my age category has this.
This looks suspiciously incorrect.
53% if 65+ have saved $0 for retirement. I’d like to know the definitions of some words and the methodology for determining this.
Maybe I’m not understanding this graph, but does the Boomer+ demo having the largest $0 proportion mean that, right now, half of that cohort have exhausted whatever savings they might have had, or does it mean they never had the savings? If the former, I’m not sure this graph is particularly helpful.
The older group had pensions. I doubt those are looked at the same as 401ks or IRAs and might explain some of the gap there.
And this is why welfare exists! No one should be going hungry or cold, especially those who can’t work anymore.
Half under 35 at 0 is fucking crazy. I’m behind by traditional advice but the top 5% in the age group. Only possible given my high income (lady luck smiled on me half a decade ago). Even if a significant portion forgoed retirement savings to buy a house now, that is a hell of a bet on real estate value.
I mean, this seems like a catastrophe waiting in the deep.
I’d like to see this as a life table, corrected for age.
Of course young people, who have more earning time and more compound-interest time ahead of them, “should” have less saved than old ones. But how were today’s 50-yos doing when they were 20?
My buddy (married, family of 4, his wife is SAHM, so single income, no extravagant expenses, does travel internationally to wife’s home country but mostly on miles) has over $3m (excluding home equity) at 55 and it’s not even close to what his financial advisor says he needs to continue living in a high COL area.
TIL I’m in the top group for my age bracket. let’s go
Scary how big that $0 group is
They took out some wealthier households because of sample size concerns? that seems a bit like putting your thumb on the scale.
also, I think looking at only retirement accounts is a bit misleading since there are plenty of people who have tons of home equity value who will likely sell and move somewhere smaller and cheaper when they retire.
(I believe the decline in home values that we are seeing is going to be the thing that indirectly causes a deep recession. even if most people have low mortgage payments, they are going to cut back on spending if the see the value of their home decline and know that they need to start saving more for retirement. there will be a cascade effect from lowering home prices.)
The report calls out it does not include DB pension which was standard until like 20 years ago. So older age groups should all increase while little effect on youngest age group.
Edit: Also not included are home equity, investment accounts or even checking accounts. The data only includes IRA and DC plans. Only calling out DB as it is also a main source of retirement income.
I know shit’s fucked, but that 0 range seems incredibly high.
Is this per household or individual? And I feel like the sample size must be absolute garbage if under 35 with >250K doesn’t even make the chart.
Thumbnail looks like Brazil.
The problem with this graph is that it does not take in what previous generations did at that age. Granted the 401k and IRAs were created in the 1970s but people were saving money for retirement for hundreds of years.
I look at squirrels and think why humans cant be like them. Instant gratification must be a human problem.
So millennials onwards are fucked?
This doesn’t include 401k ? Just Ira?
The method is still unclear. Suppose a married couple have individual IRA accounts with one four times the amount in the other’s. Did they get averaged? Counted as one having above a million and the other less than 100K? It could misrepresent the household numbers.
I was doing great until I had a medical emergency and insurance refused to cover anything so I had to liquidate my entire 401k to pay medical bills 🫠
Those over 65 actually are less likely to have more than a million in savings than those 60 years old?
I think we might need to break 65+ into multiple brackets:
65-74, 75-84, 85+
I’m curious if the retirees have spent down their savings money or if they never had it to begin with
Here is my personal graph:
https://preview.redd.it/zeksk7jvve7g1.jpeg?width=2000&format=pjpg&auto=webp&s=e292227b2540ecd26d348360cbb9c9e9167a156d
Ooof. So like over half of the populations retirement will be like an extended vacation then back to work?
And they wonder why no one is having kids.
Not too meaningful, since Americans save mostly through real estate. If you have a paid-off house and social security, a small IRA balance isn’t the end of the world. Harder to buy that house for younger generations of course.
Crazy that despite living in a world of material and financial abundance where we’ve made tremendous gains in our productivity, we still work people to the day they die like we’re living in 1407. All to make a small handful of blokes even richer. Absolute backwaters of countries we live in.
This is terrifying. This is why financial literacy needs to be taught in schools from a young age.
Comments are closed.