
Approach 1: EQT Discounted Cash Flow (DCF) Analysis
A Discounted Cash Flow model estimates what a company is worth by projecting future cash flows and discounting them back to today, to reflect risk and the time value of money.
For EQT, the model starts with last twelve month Free Cash Flow of about $2.1 billion and uses analyst forecasts for the next few years, then extrapolates beyond that. By 2029, EQT’s Free Cash Flow is projected to be roughly $2.6 billion. The extended 10 year view shows cash flows broadly holding in the low to mid $2 billion range in today’s dollars, after discounting.
When these projected cash flows are summed and adjusted for shareholders, the DCF model points to an intrinsic value of about $86.84 per share. Versus a recent share price around $53.87, that implies EQT is trading at roughly a 38.0% discount to its estimated fair value. This indicates potential upside if these cash flow expectations play out.
Result: UNDERVALUED
Our Discounted Cash Flow (DCF) analysis suggests EQT is undervalued by 38.0%. Track this in your watchlist or portfolio, or discover 914 more undervalued stocks based on cash flows.
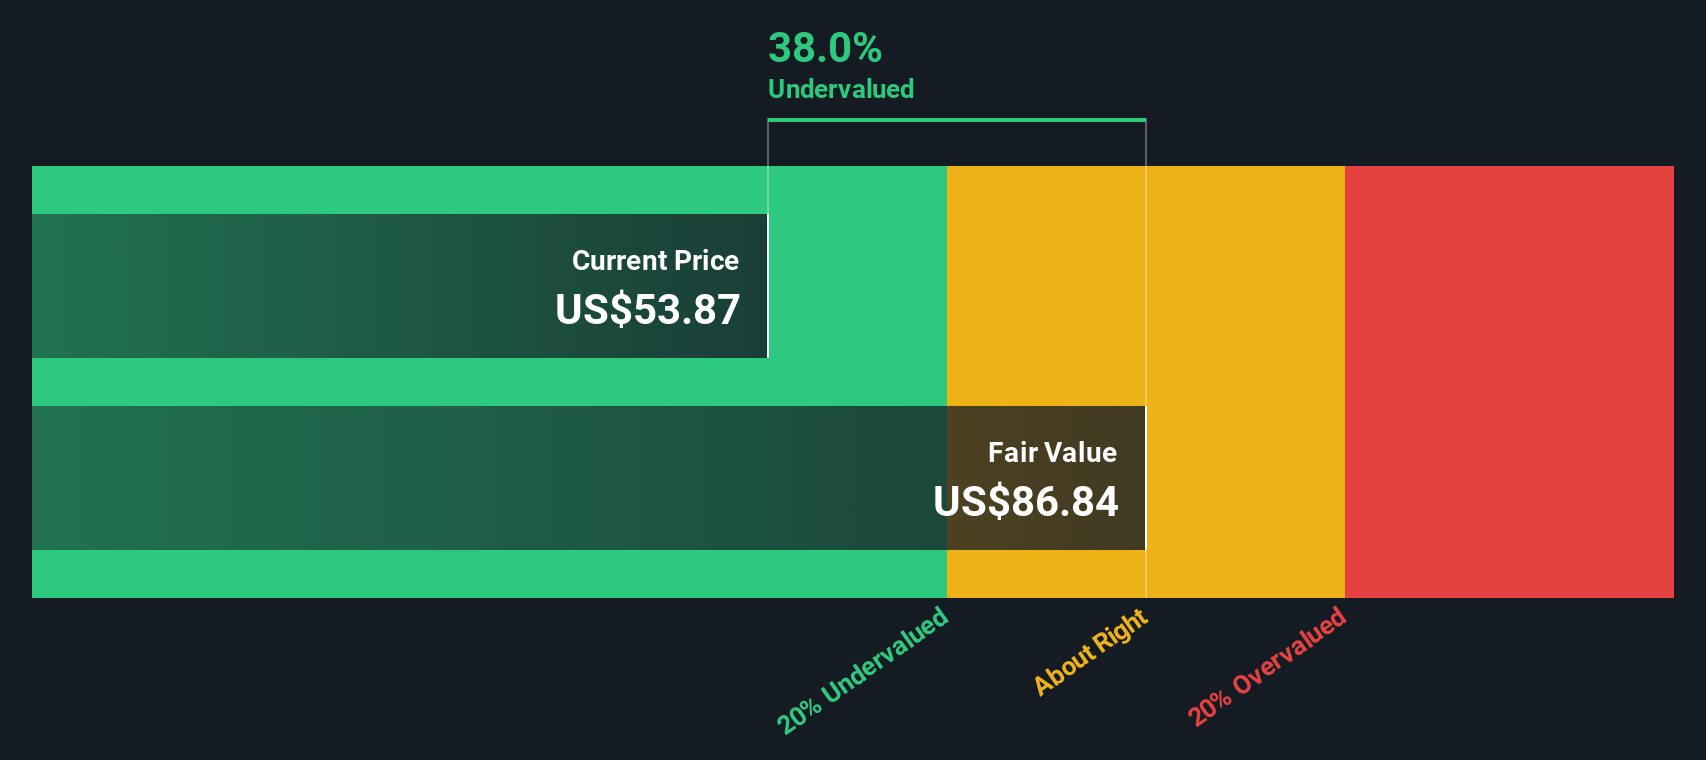 EQT Discounted Cash Flow as at Dec 2025
Approach 2: EQT Price vs Earnings
For a profitable producer like EQT, the Price to Earnings, or PE, ratio is a useful way to gauge how much investors are paying for each dollar of current earnings. In general, companies with faster, more reliable earnings growth and lower perceived risk can justify a higher PE, while slower growth or higher risk tends to pull a fair multiple down.
EQT currently trades on a PE of about 18.9x, which is above the Oil and Gas industry average of roughly 13.0x and also higher than the peer group average near 15.0x. To go a step beyond these simple comparisons, Simply Wall St estimates a proprietary Fair Ratio for EQT of around 22.2x. This Fair Ratio reflects what a reasonable PE might be once factors like EQT’s earnings growth profile, industry dynamics, profitability, size and risk are all considered together.
Because the Fair Ratio is tailored to EQT’s specific fundamentals instead of relying only on broad industry or peer averages, it offers a more nuanced read on valuation. With the current PE of 18.9x sitting below the 22.2x Fair Ratio, this lens suggests the market is still discounting EQT’s prospects.
Result: UNDERVALUED
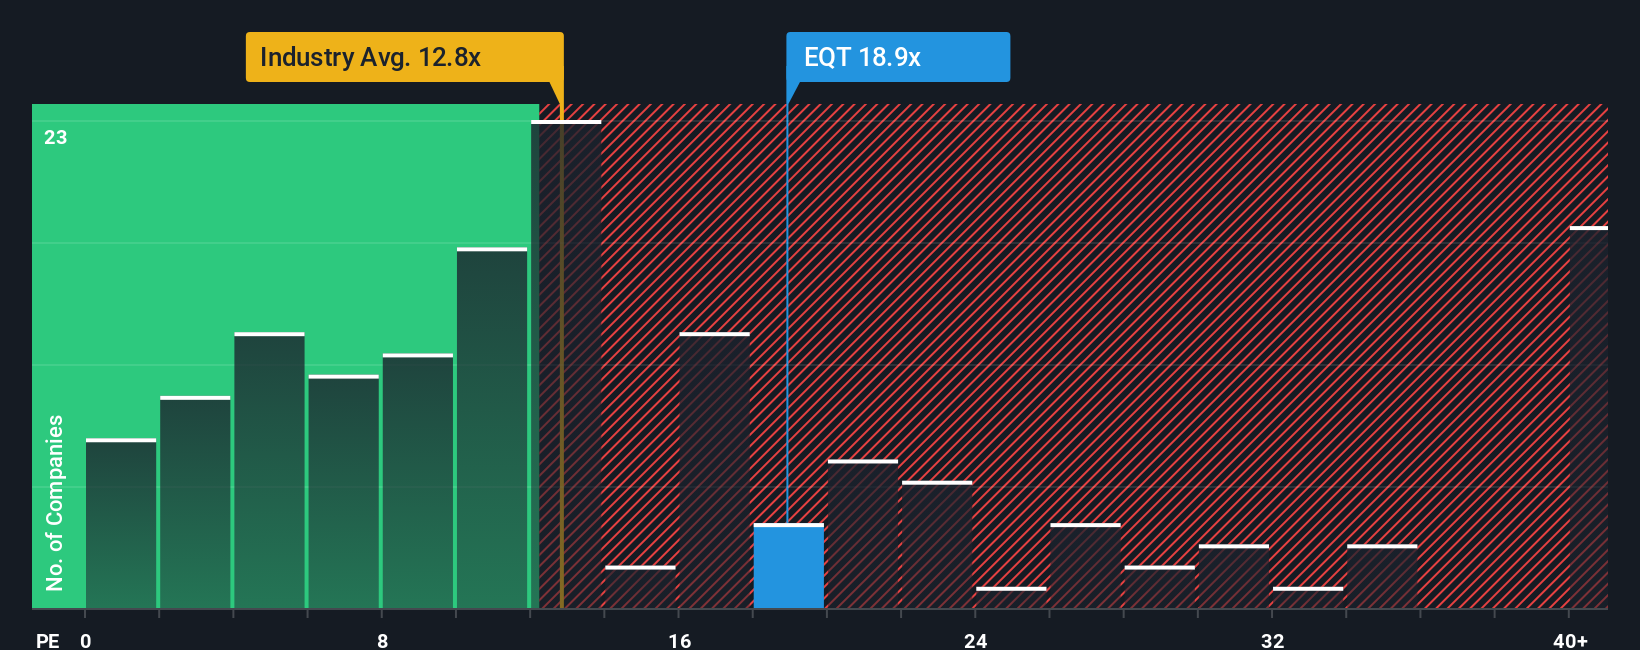 NYSE:EQT PE Ratio as at Dec 2025
PE ratios tell one story, but what if the real opportunity lies elsewhere? Discover 1466 companies where insiders are betting big on explosive growth.
Upgrade Your Decision Making: Choose your EQT Narrative
Earlier we mentioned that there is an even better way to understand valuation, so let us introduce you to Narratives. This is a simple framework on Simply Wall St’s Community page that lets you attach a clear story to your numbers by spelling out how you think EQT’s revenue, earnings and margins evolve. It then turns that story into a financial forecast, and then into a Fair Value you can compare to today’s price to decide whether to buy, hold or sell. The platform dynamically updates your Narrative as new news or earnings arrive, and makes it easy to see, for instance, how a bullish investor expecting stronger LNG-driven demand might justify a Fair Value closer to the top of the current analyst range around $80, while a more cautious investor focused on regulatory and decarbonization risks might land near the low end closer to $42, both backing their views with explicit assumptions rather than vague hunches.
Do you think there’s more to the story for EQT? Head over to our Community to see what others are saying!
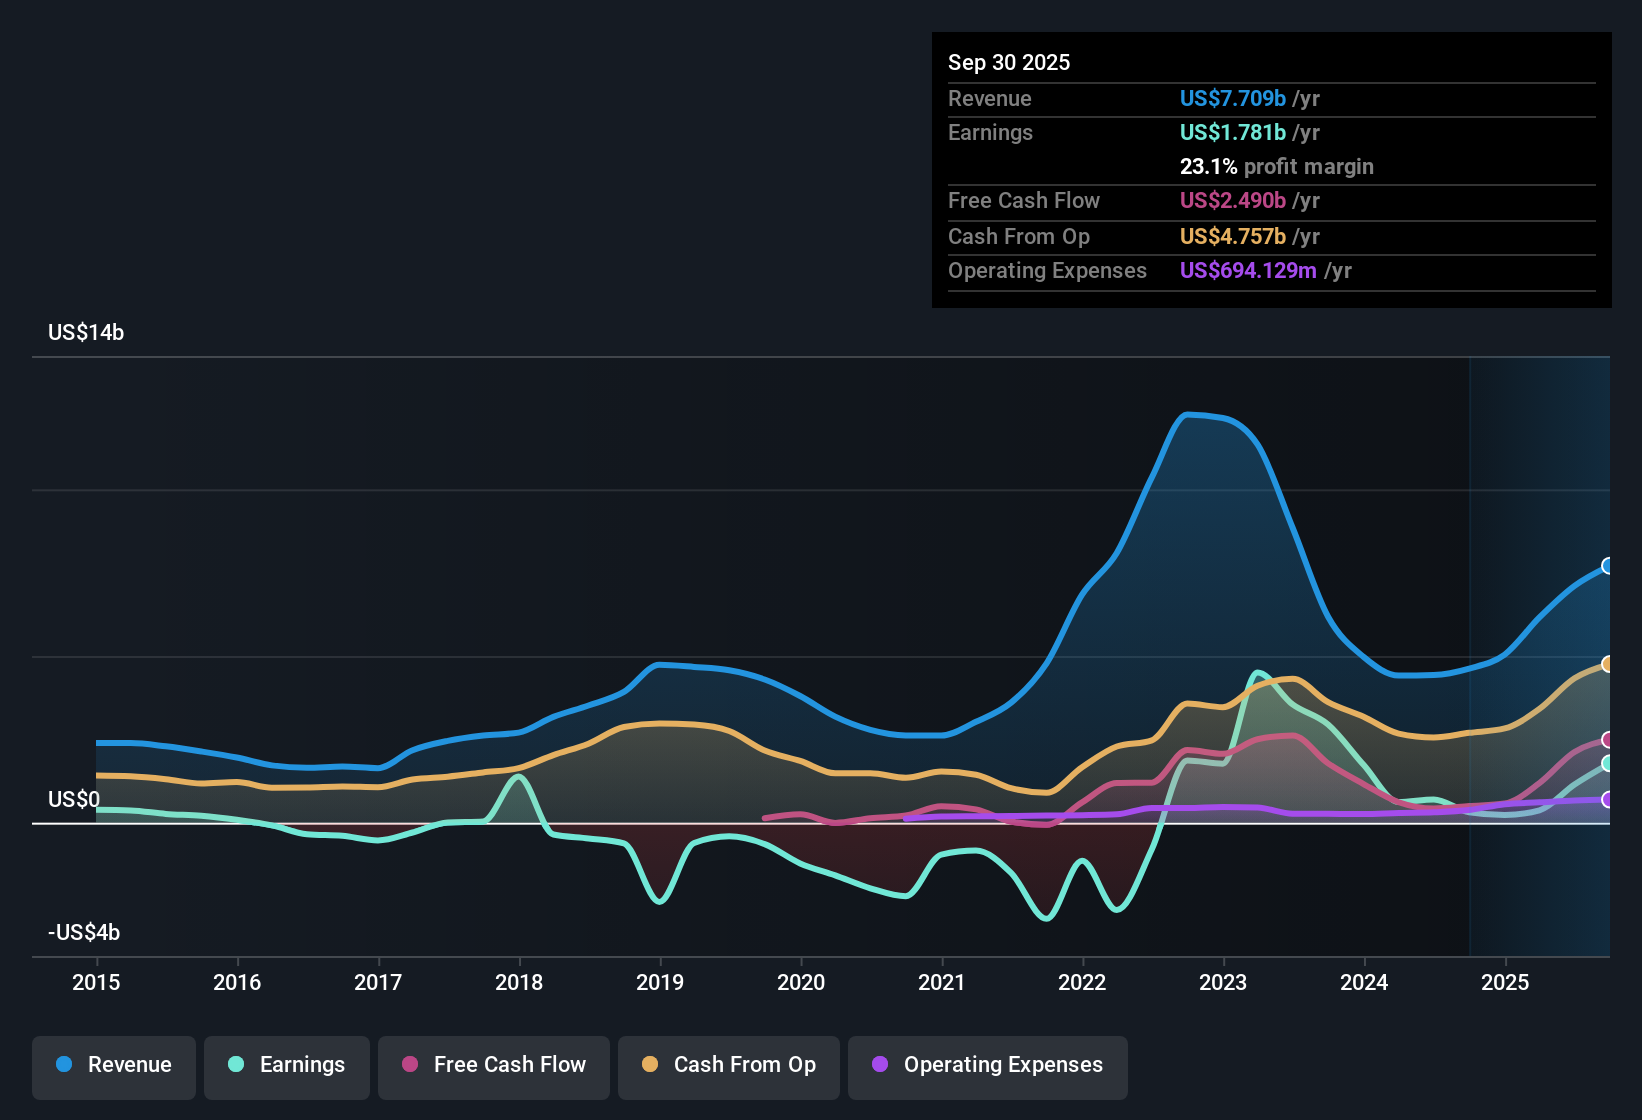 NYSE:EQT Earnings & Revenue History as at Dec 2025
This article by Simply Wall St is general in nature. We provide commentary based on historical data
and analyst forecasts only using an unbiased methodology and our articles are not intended to be financial advice. It does not constitute a recommendation to buy or sell any stock, and does not take account of your objectives, or your
financial situation. We aim to bring you long-term focused analysis driven by fundamental data.
Note that our analysis may not factor in the latest price-sensitive company announcements or qualitative material.
Simply Wall St has no position in any stocks mentioned.
Discover if EQT might be undervalued or overvalued with our detailed analysis, featuring fair value estimates, potential risks, dividends, insider trades, and its financial condition.
Have feedback on this article? Concerned about the content? Get in touch with us directly. Alternatively, email editorial-team@simplywallst.com