
D-Wave Quantum scores just 2/6 on our valuation checks. See what other red flags we found in the full valuation breakdown.
Approach 1: D-Wave Quantum Discounted Cash Flow (DCF) Analysis
A Discounted Cash Flow, or DCF, model takes projections of a company’s future cash flows, then discounts them back to today’s dollars to estimate what the business might be worth now.
For D-Wave Quantum, Simply Wall St uses a 2 Stage Free Cash Flow to Equity model. The latest trailing twelve month free cash flow is a loss of about $54.9 million. Analyst and extrapolated projections in the model show free cash flow staying negative in the nearer years, then turning positive and reaching $461.4 million in 2030, with further increases projected beyond that. Figures beyond the initial analyst horizon are extrapolated by Simply Wall St rather than coming from direct analyst forecasts.
On this basis, the model arrives at an estimated intrinsic value of about $79.63 per share, compared with the recent share price of $30.64. That gap implies the shares trade at roughly a 61.5% discount to this particular DCF estimate. On this model, D-Wave Quantum screens as materially undervalued.
Result: UNDERVALUED
Our Discounted Cash Flow (DCF) analysis suggests D-Wave Quantum is undervalued by 61.5%. Track this in your watchlist or portfolio, or discover 879 more undervalued stocks based on cash flows.
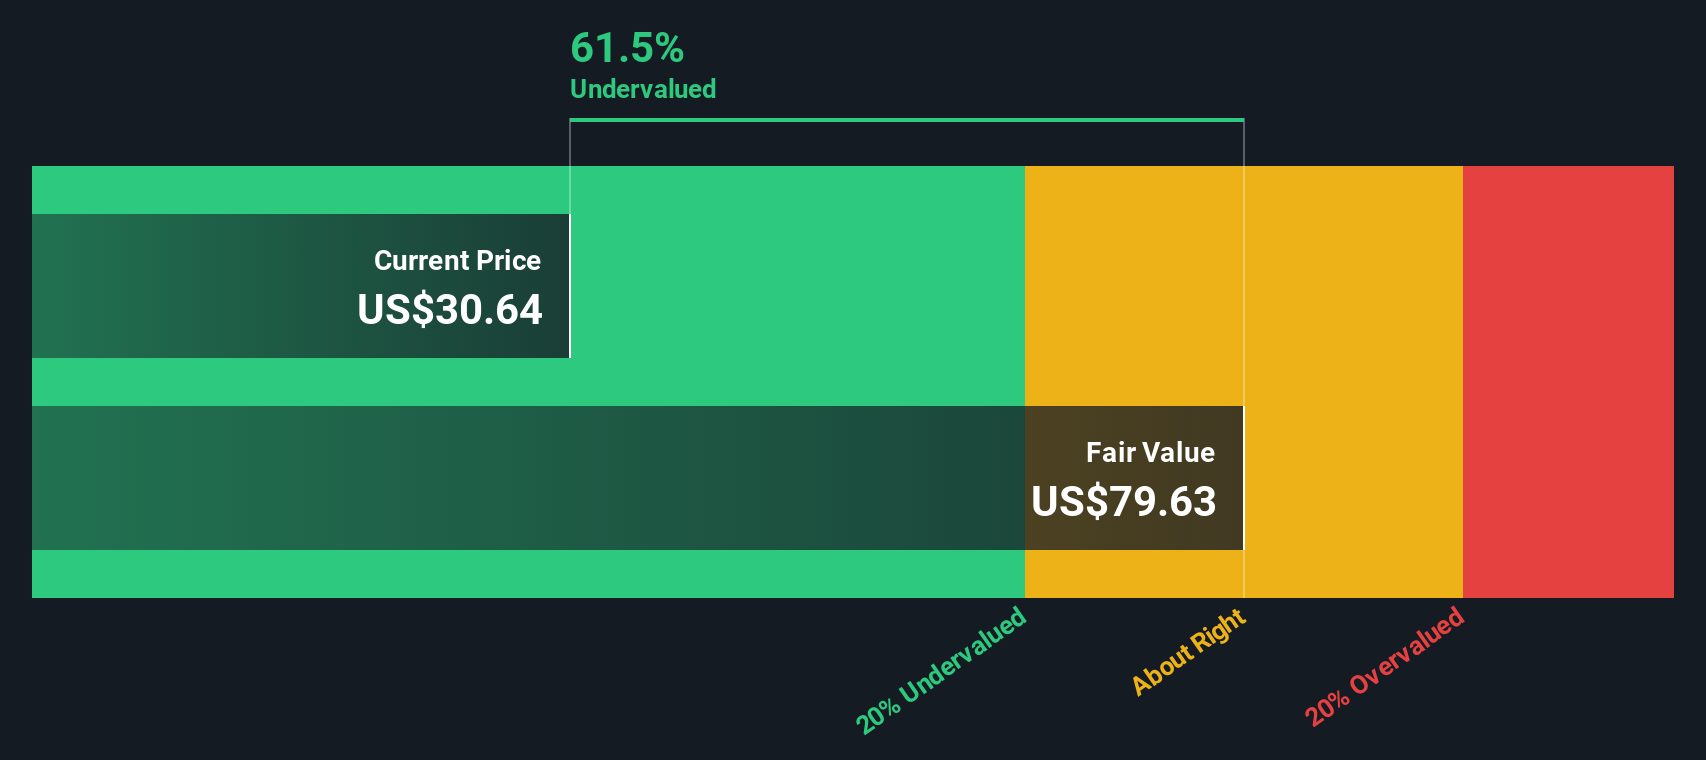 QBTS Discounted Cash Flow as at Jan 2026
Approach 2: D-Wave Quantum Price vs Book
For companies where current profits are limited or volatile, price based on book value can sometimes be a more grounded anchor than earnings or sales based metrics. The P/B ratio asks a simple question: how much are you paying for each dollar of net assets on the balance sheet.
In general, higher growth expectations and lower perceived risk can justify a higher “normal” P/B multiple, while slower growth or higher uncertainty tend to align with lower multiples. Benchmarks help frame this. D-Wave Quantum currently trades on a P/B of 16.0x, compared with the Software industry average of about 3.4x and a peer group average of 9.6x, so the stock sits well above both of these reference points.
Simply Wall St also calculates a proprietary “Fair Ratio” for the preferred multiple, which is the level you might expect given factors such as earnings growth, industry, profit margins, market cap and specific risk profile. This Fair Ratio can be more informative than a basic peer or industry comparison because it tries to adjust for differences in quality and risk, rather than assuming all software names deserve the same multiple. In this case, the Fair Ratio is not available, so no conclusion is drawn on whether the current P/B of 16.0x looks overvalued, undervalued, or about right.
Result: ABOUT RIGHT
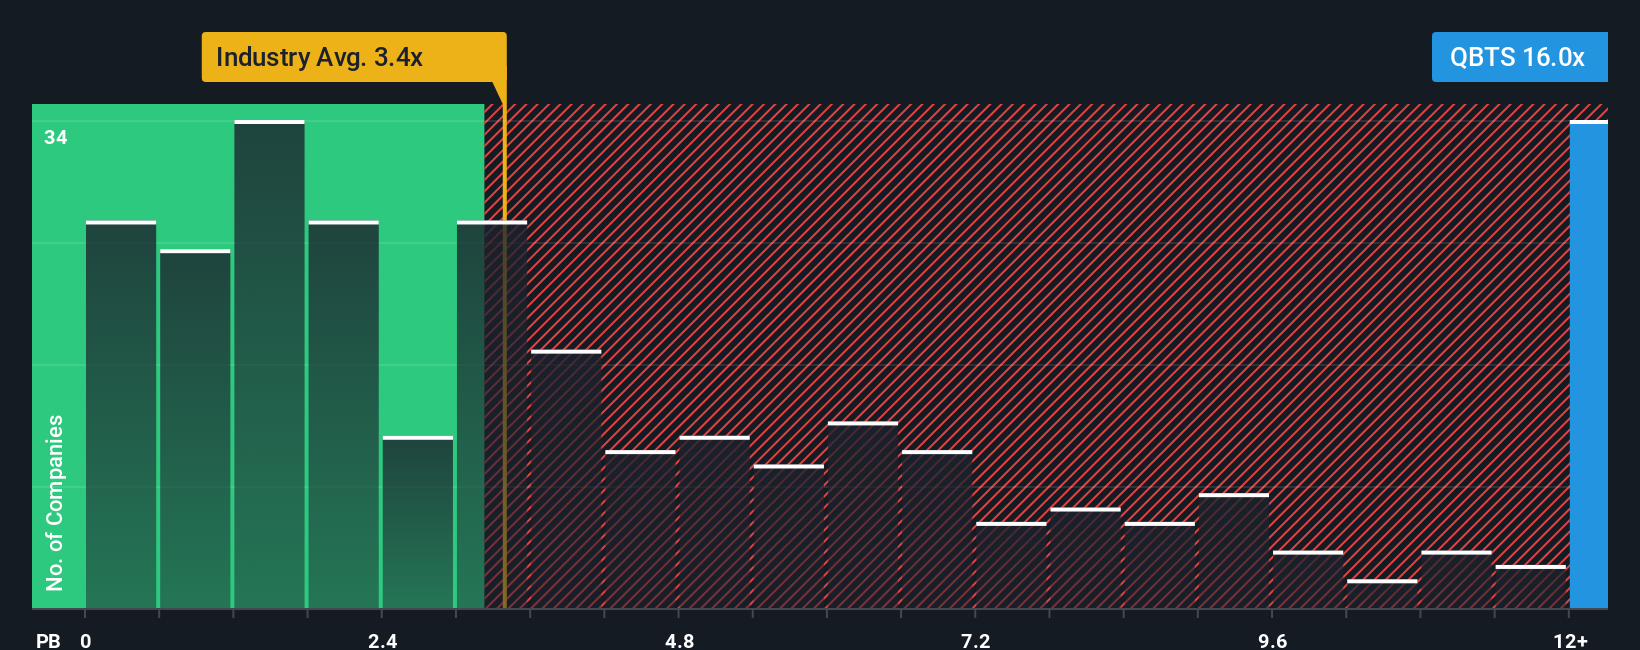 NYSE:QBTS P/B Ratio as at Jan 2026
P/B ratios tell one story, but what if the real opportunity lies elsewhere? Discover 1456 companies where insiders are betting big on explosive growth.
Upgrade Your Decision Making: Choose your D-Wave Quantum Narrative
Earlier we mentioned that there is an even better way to understand valuation, so let us introduce you to Narratives, which are simply your story about a company linked directly to numbers like expected revenue, earnings, margins and the fair value you think is reasonable.
A Narrative connects three pieces: what you believe about a company’s business, how that belief translates into a financial forecast, and the fair value that drops out of those assumptions.
On Simply Wall St’s Community page, used by millions of investors, Narratives are an easy tool you can set up in minutes so you can compare your Fair Value to the current share price and decide for yourself whether conditions look closer to a buying opportunity, a hold, or a time to reduce exposure.
Because Narratives update automatically when new information such as earnings releases or major news is entered into the model, your view of D-Wave Quantum’s fair value can shift in real time as the story changes.
For D-Wave Quantum, one investor might build a Narrative that points to a very optimistic fair value based on strong long term adoption of quantum solutions, while another might set a far lower fair value if they assume slower commercialization, higher funding needs, or more modest margins from its technology.
Do you think there’s more to the story for D-Wave Quantum? Head over to our Community to see what others are saying!
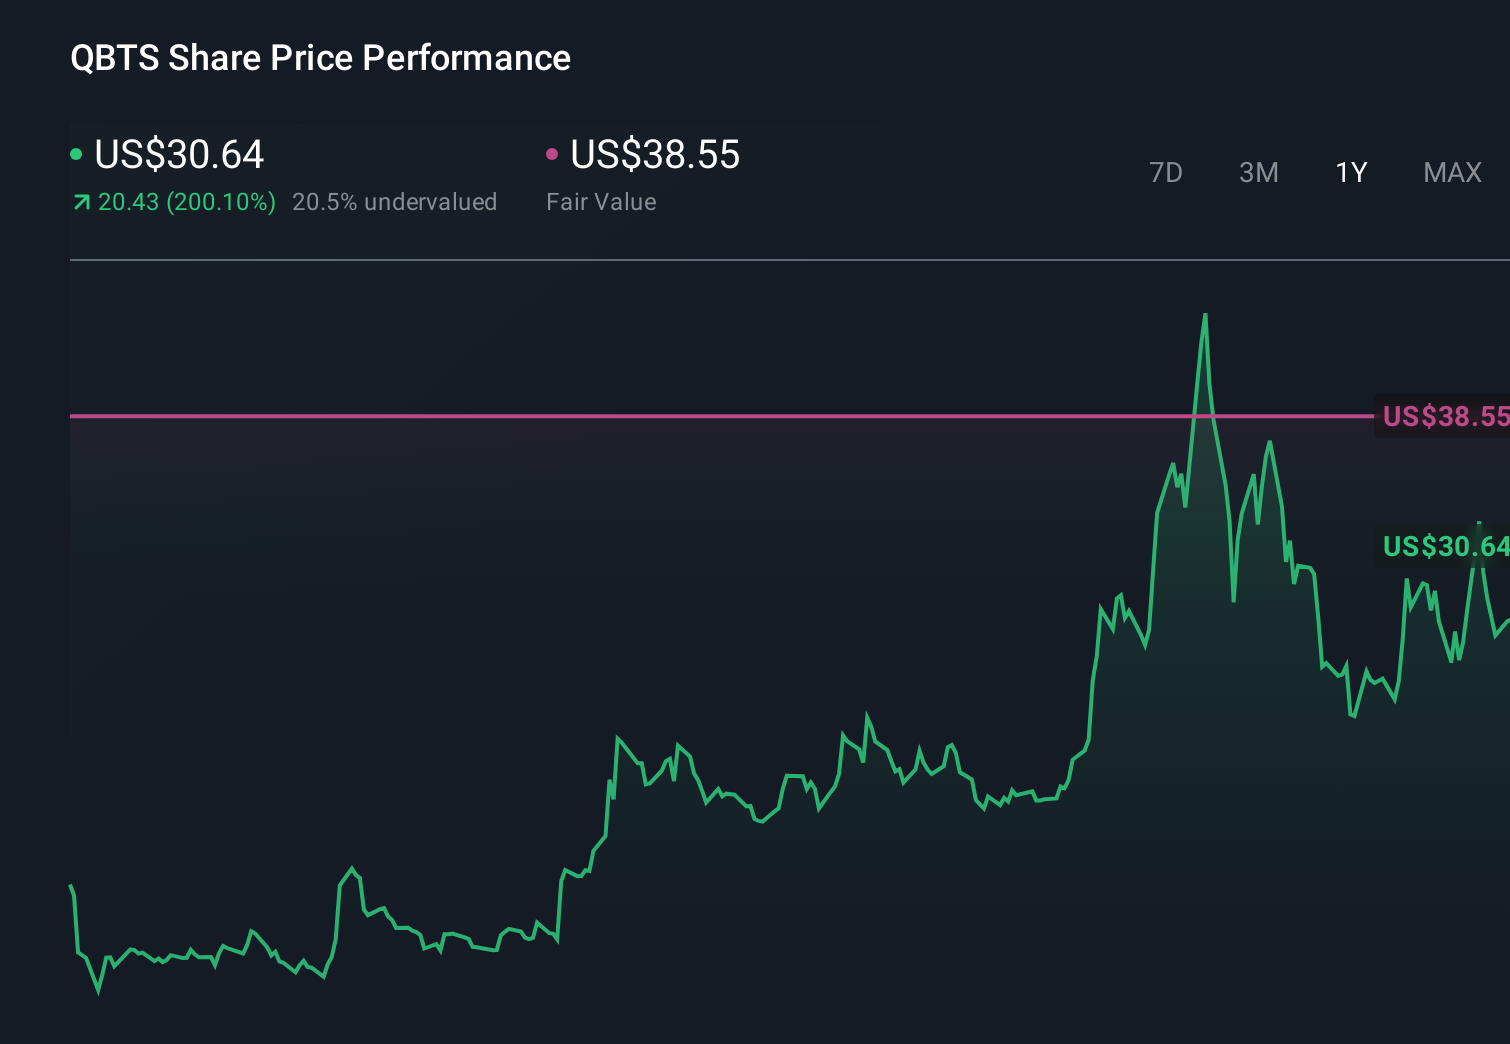 NYSE:QBTS 1-Year Stock Price Chart
This article by Simply Wall St is general in nature. We provide commentary based on historical data
and analyst forecasts only using an unbiased methodology and our articles are not intended to be financial advice. It does not constitute a recommendation to buy or sell any stock, and does not take account of your objectives, or your
financial situation. We aim to bring you long-term focused analysis driven by fundamental data.
Note that our analysis may not factor in the latest price-sensitive company announcements or qualitative material.
Simply Wall St has no position in any stocks mentioned.
We’ve created the ultimate portfolio companion for stock investors, and it’s free.
• Connect an unlimited number of Portfolios and see your total in one currency
• Be alerted to new Warning Signs or Risks via email or mobile
• Track the Fair Value of your stocks
Have feedback on this article? Concerned about the content? Get in touch with us directly. Alternatively, email editorial-team@simplywallst.com