Approach 1: SolarEdge Technologies Discounted Cash Flow (DCF) Analysis
A DCF model takes estimated future cash flows and discounts them back to today using a required return, then adds them up to arrive at an estimated intrinsic value per share.
For SolarEdge Technologies, the model uses a 2 Stage Free Cash Flow to Equity approach based on cash flow projections in $. The latest twelve month free cash flow is reported at $22.88 million, and analysts provide explicit free cash flow estimates out to 2030, with Simply Wall St extrapolating further projections out to 2035.
Across this period, the model includes discounted free cash flow estimates such as $125.36 million for 2026, $131.06 million for 2027 and $107.44 million for 2030, along with further extrapolated values through 2035.
Based on these projections, the DCF model indicates an estimated intrinsic value of about $22.69 per share, compared with the current share price of $30.78. On this specific set of cash flow assumptions, the stock appears to be around 35.6% overvalued.
Result: OVERVALUED
Our Discounted Cash Flow (DCF) analysis suggests SolarEdge Technologies may be overvalued by 35.6%. Discover 875 undervalued stocks or create your own screener to find better value opportunities.
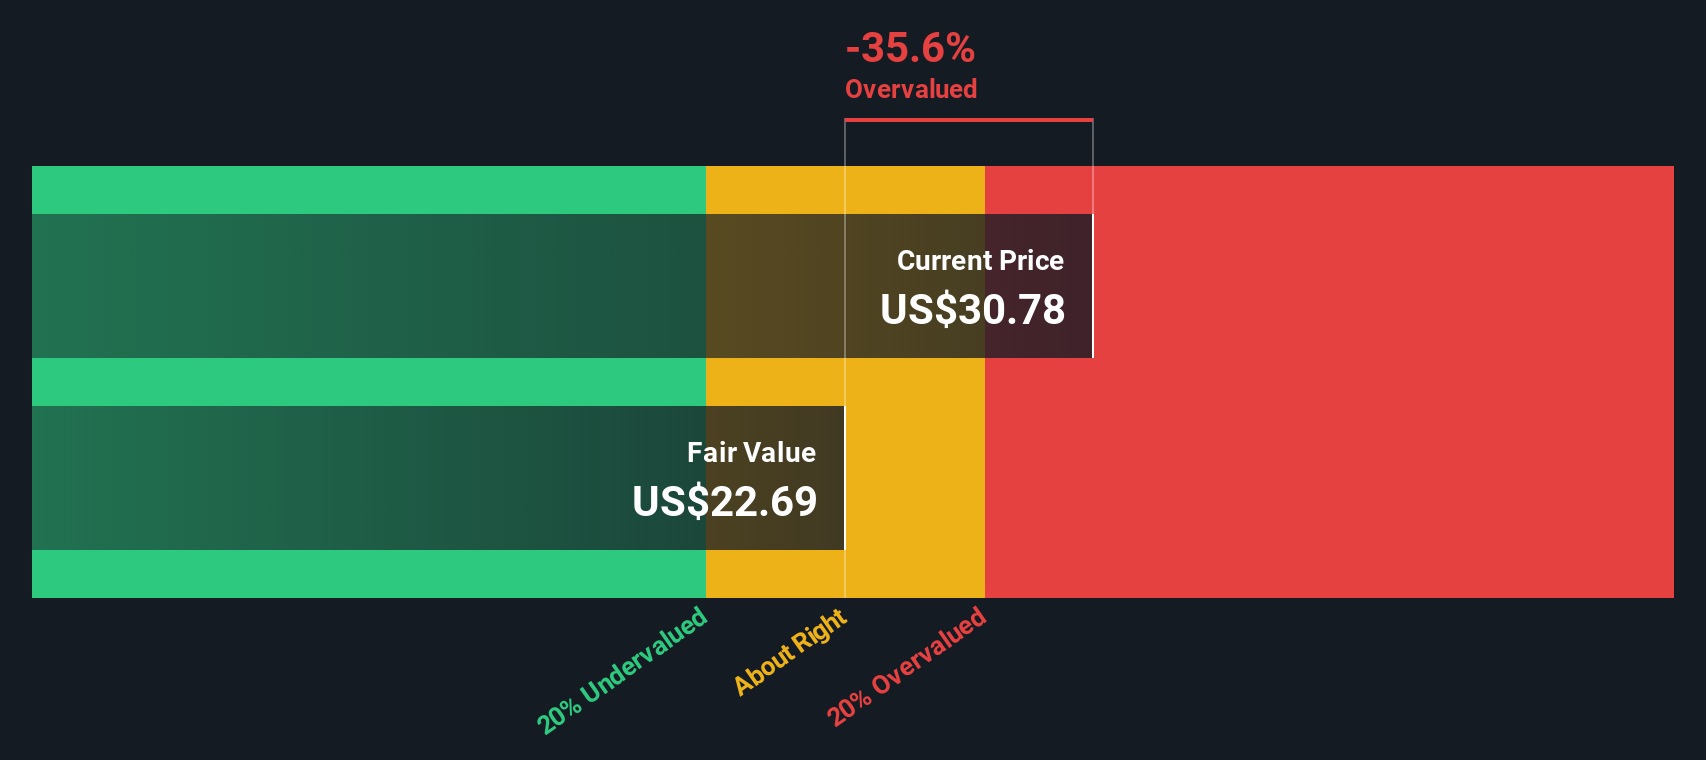 SEDG Discounted Cash Flow as at Jan 2026
Approach 2: SolarEdge Technologies Price vs Sales
For companies where earnings are limited or volatile, the P/S ratio is often more useful than P/E because it anchors valuation to revenue rather than profit, which can swing around with margins and investment cycles.
What counts as a “normal” or “fair” P/S ratio usually reflects how the market views a company’s growth potential and risk. Higher expected growth and lower perceived risk can support a higher multiple, while slower growth or higher risk tends to justify a lower one.
SolarEdge Technologies currently trades on a P/S of 1.76x. That is below the Semiconductor industry average P/S of 5.71x and below the peer group average of 3.31x. Simply Wall St’s Fair Ratio model, which estimates what P/S might be reasonable after considering factors such as growth profile, profit margins, industry, market cap and risk, arrives at a Fair P/S of 1.87x.
This Fair Ratio can be more informative than a simple industry or peer comparison because it adjusts for company specific characteristics rather than assuming all peers should share the same multiple. Compared with the current 1.76x, the Fair Ratio of 1.87x suggests the shares look undervalued on this basis.
Result: UNDERVALUED
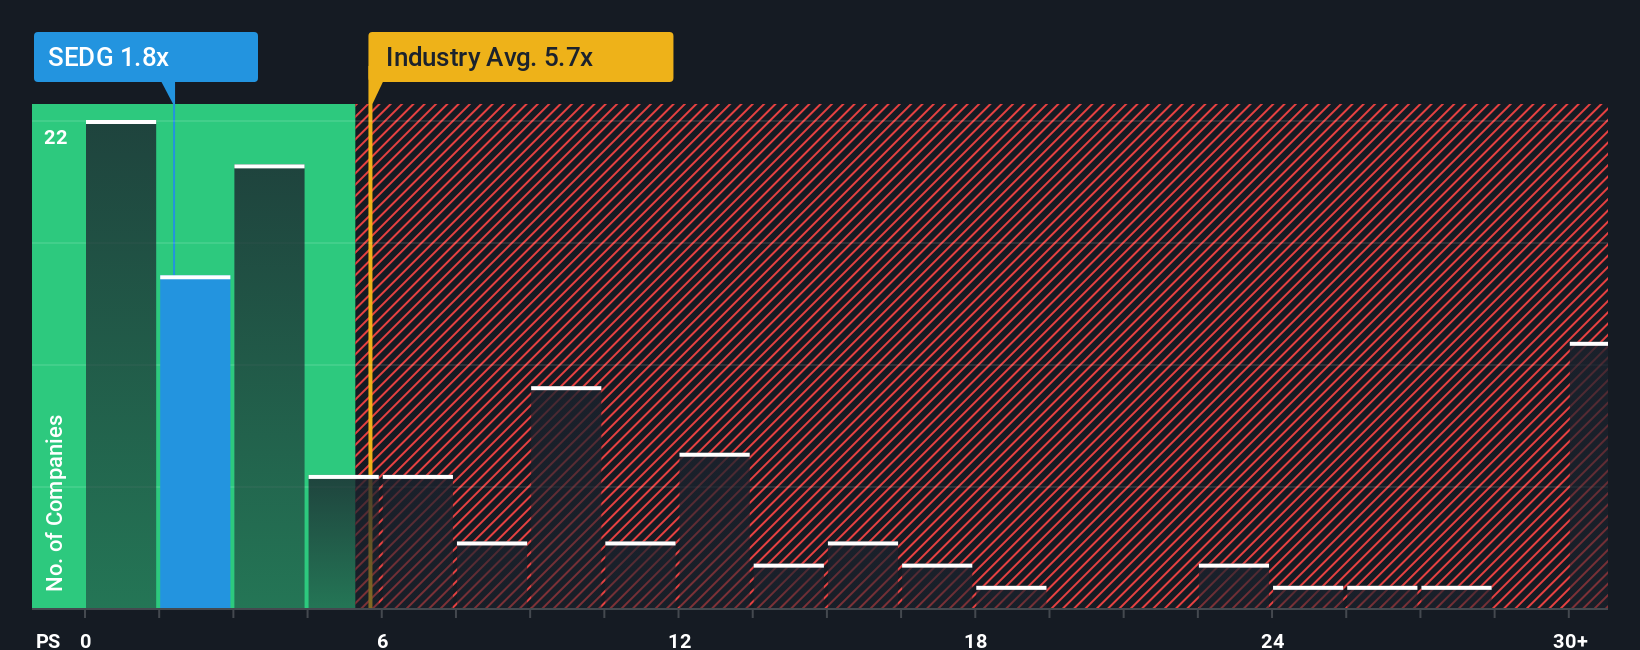 NasdaqGS:SEDG P/S Ratio as at Jan 2026
P/S ratios tell one story, but what if the real opportunity lies elsewhere? Discover 1447 companies where insiders are betting big on explosive growth.
Upgrade Your Decision Making: Choose your SolarEdge Technologies Narrative
Earlier we mentioned that there is an even better way to understand valuation. Narratives on Simply Wall St let you set a clear story for SolarEdge Technologies, link that story to your own revenue, earnings and margin assumptions, turn those into a fair value, and then compare that fair value with the current price. All of this is available within an easy tool on the Community page that updates as new earnings or news arrive. One investor might build a more cautious SolarEdge Narrative closer to the US$7 bearish analyst target, while another might lean toward a more optimistic view nearer the US$35 bullish target. The platform helps each of them see how their story and numbers connect without forcing either to accept a single “right” answer.
Do you think there’s more to the story for SolarEdge Technologies? Head over to our Community to see what others are saying!
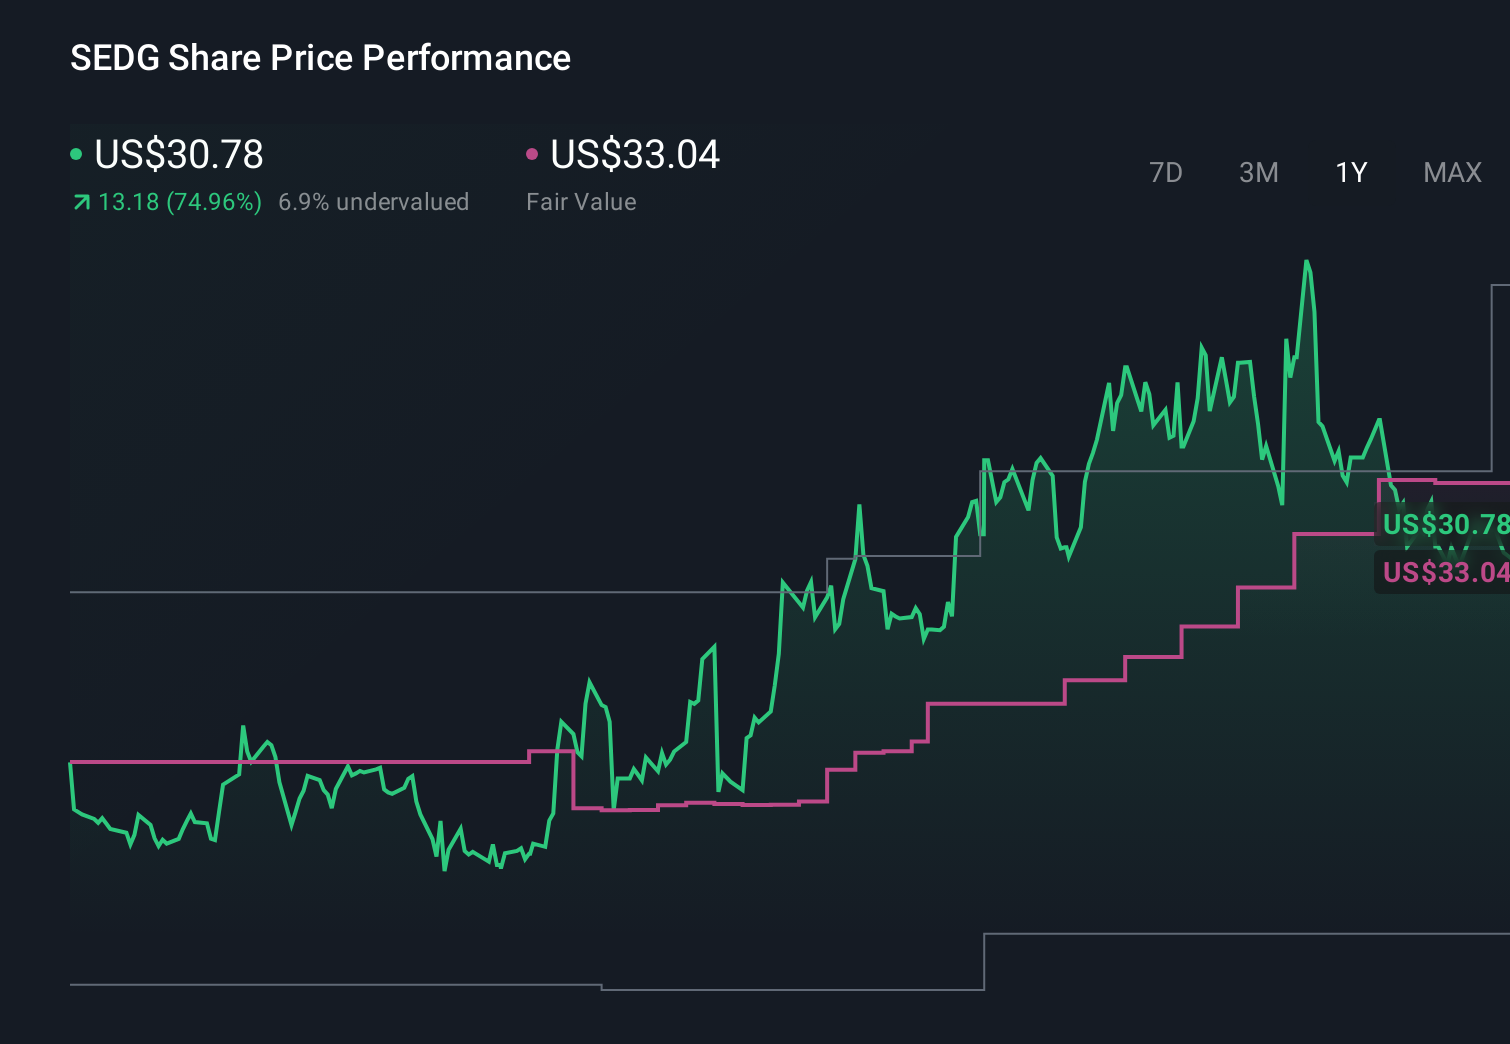 NasdaqGS:SEDG 1-Year Stock Price Chart
This article by Simply Wall St is general in nature. We provide commentary based on historical data
and analyst forecasts only using an unbiased methodology and our articles are not intended to be financial advice. It does not constitute a recommendation to buy or sell any stock, and does not take account of your objectives, or your
financial situation. We aim to bring you long-term focused analysis driven by fundamental data.
Note that our analysis may not factor in the latest price-sensitive company announcements or qualitative material.
Simply Wall St has no position in any stocks mentioned.
We’ve created the ultimate portfolio companion for stock investors, and it’s free.
• Connect an unlimited number of Portfolios and see your total in one currency
• Be alerted to new Warning Signs or Risks via email or mobile
• Track the Fair Value of your stocks
Have feedback on this article? Concerned about the content? Get in touch with us directly. Alternatively, email editorial-team@simplywallst.com