
Find out why Chord Energy’s -23.8% return over the last year is lagging behind its peers.
Approach 1: Chord Energy Discounted Cash Flow (DCF) Analysis
A Discounted Cash Flow, or DCF, model estimates what a business could be worth today by projecting its future cash flows and then discounting those back to a single present value figure.
For Chord Energy, the model starts with last twelve month Free Cash Flow (FCF) of about $947.9 million. Analysts provide FCF estimates for the coming years, and then Simply Wall St extends those projections out to 2035 using a 2 Stage Free Cash Flow to Equity approach. For example, projected FCF in 2030 is $1,017 million, with intermediate years ranging from about $670 million to just over $1,064 million before discounting.
When all these projected cash flows are discounted back and added up, the model arrives at an estimated intrinsic value of $383.84 per share. Compared with the current share price of around $88.55, this implies the stock is 76.9% undervalued based on this DCF framework.
Result: UNDERVALUED
Our Discounted Cash Flow (DCF) analysis suggests Chord Energy is undervalued by 76.9%. Track this in your watchlist or portfolio, or discover 886 more undervalued stocks based on cash flows.
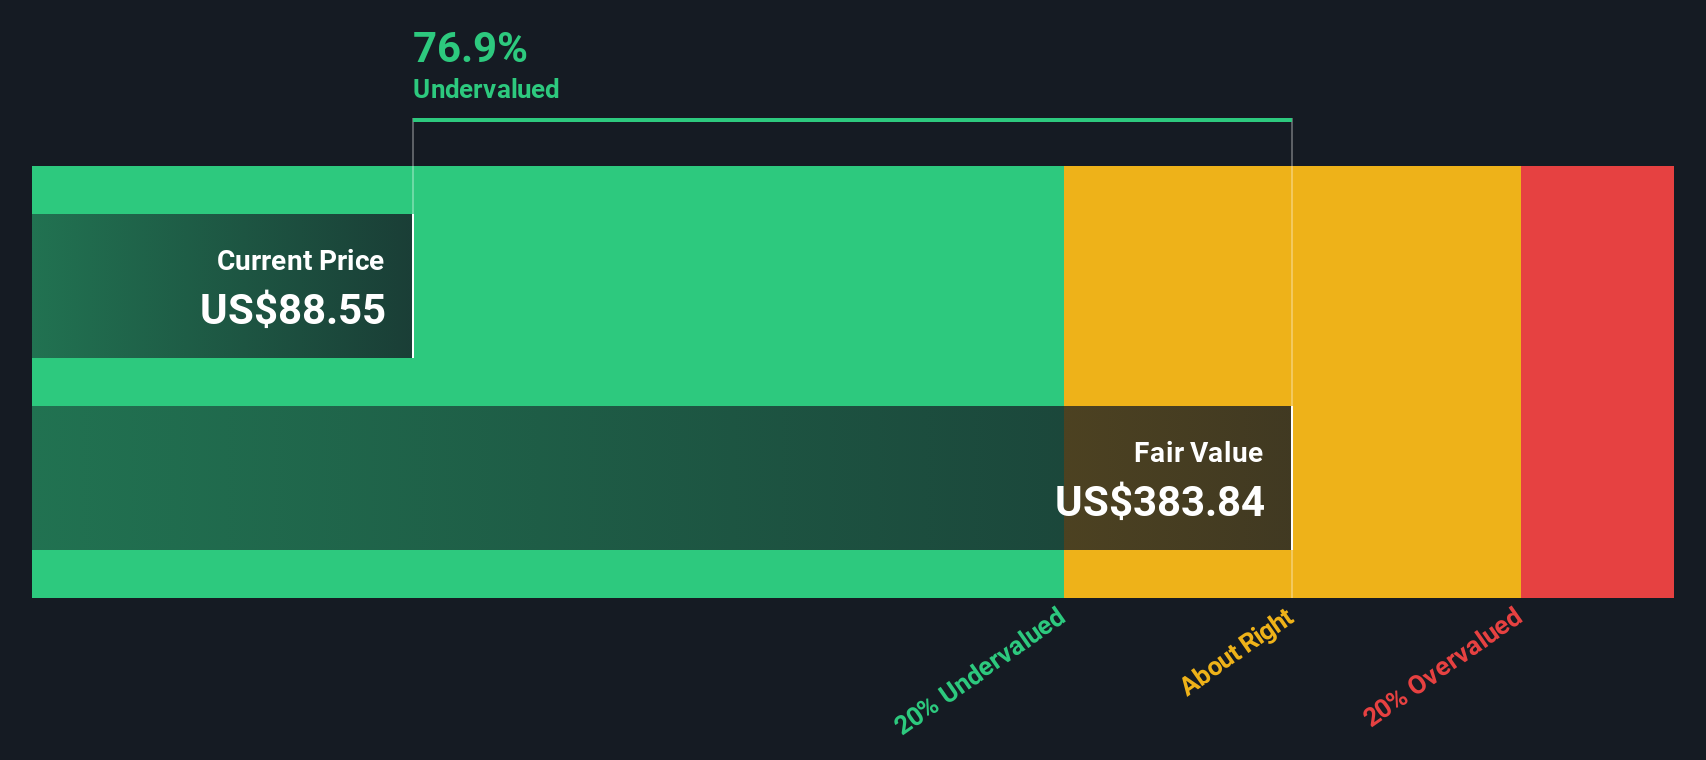 CHRD Discounted Cash Flow as at Jan 2026
Approach 2: Chord Energy Price vs Earnings
For a profitable company like Chord Energy, the P/E ratio is a useful yardstick because it links what you pay per share to the earnings the business is currently generating. Investors usually accept a higher P/E when they expect stronger growth or see lower risk, and a lower P/E when they expect slower growth or higher risk.
Chord Energy currently trades on a P/E of 29.89x. That is higher than the Oil and Gas industry average P/E of about 13.03x and below the peer group average of 35.05x. Simply Wall St also calculates a “Fair Ratio” of 22.82x, which is the P/E level suggested by factors such as the company’s earnings growth profile, industry, profit margins, market value and specific risks.
This Fair Ratio is more tailored than a simple comparison with industry or peers, because it adjusts for company specific qualities rather than assuming all Oil and Gas firms deserve the same multiple. Comparing the current 29.89x P/E with the 22.82x Fair Ratio suggests Chord Energy trades above this tailored estimate, which points to the shares looking overvalued on this metric.
Result: OVERVALUED
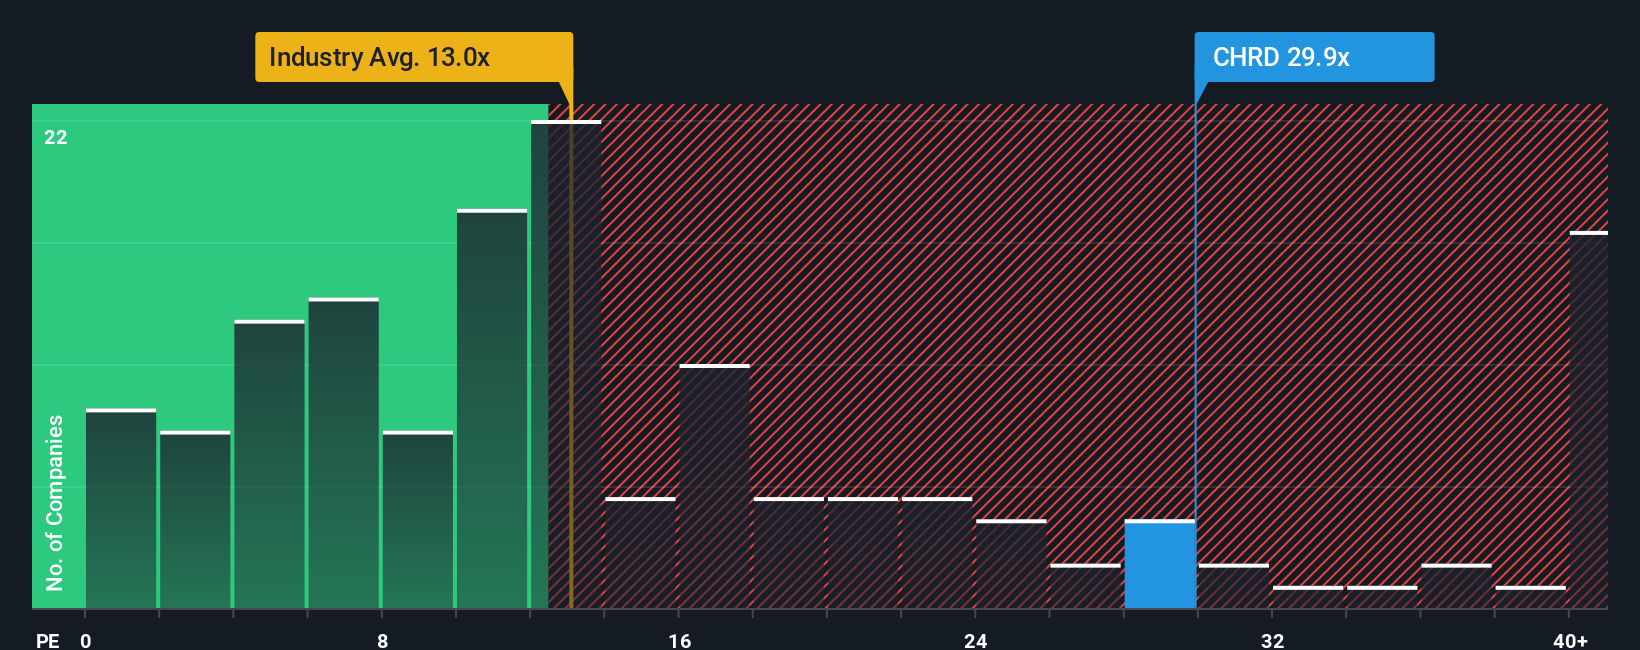 NasdaqGS:CHRD P/E Ratio as at Jan 2026
P/E ratios tell one story, but what if the real opportunity lies elsewhere? Discover 1449 companies where insiders are betting big on explosive growth.
Upgrade Your Decision Making: Choose your Chord Energy Narrative
Earlier we mentioned that there is an even better way to understand valuation. On Simply Wall St’s Community page you can use Narratives, where you and other investors link a clear story about Chord Energy to specific forecasts for revenue, earnings and margins. These then roll into a fair value that updates automatically as fresh news or earnings arrive, helping you compare that Fair Value to the current price and decide what action, if any, makes sense. For example, one Chord Energy Narrative might lean on themes like Bakken consolidation, buybacks and longer laterals to support a higher fair value closer to US$166, while a more cautious Narrative could focus on inventory depth, regulatory risk and the energy transition to support a lower fair value around US$105, all within an easy tool used by millions of investors.
Do you think there’s more to the story for Chord Energy? Head over to our Community to see what others are saying!
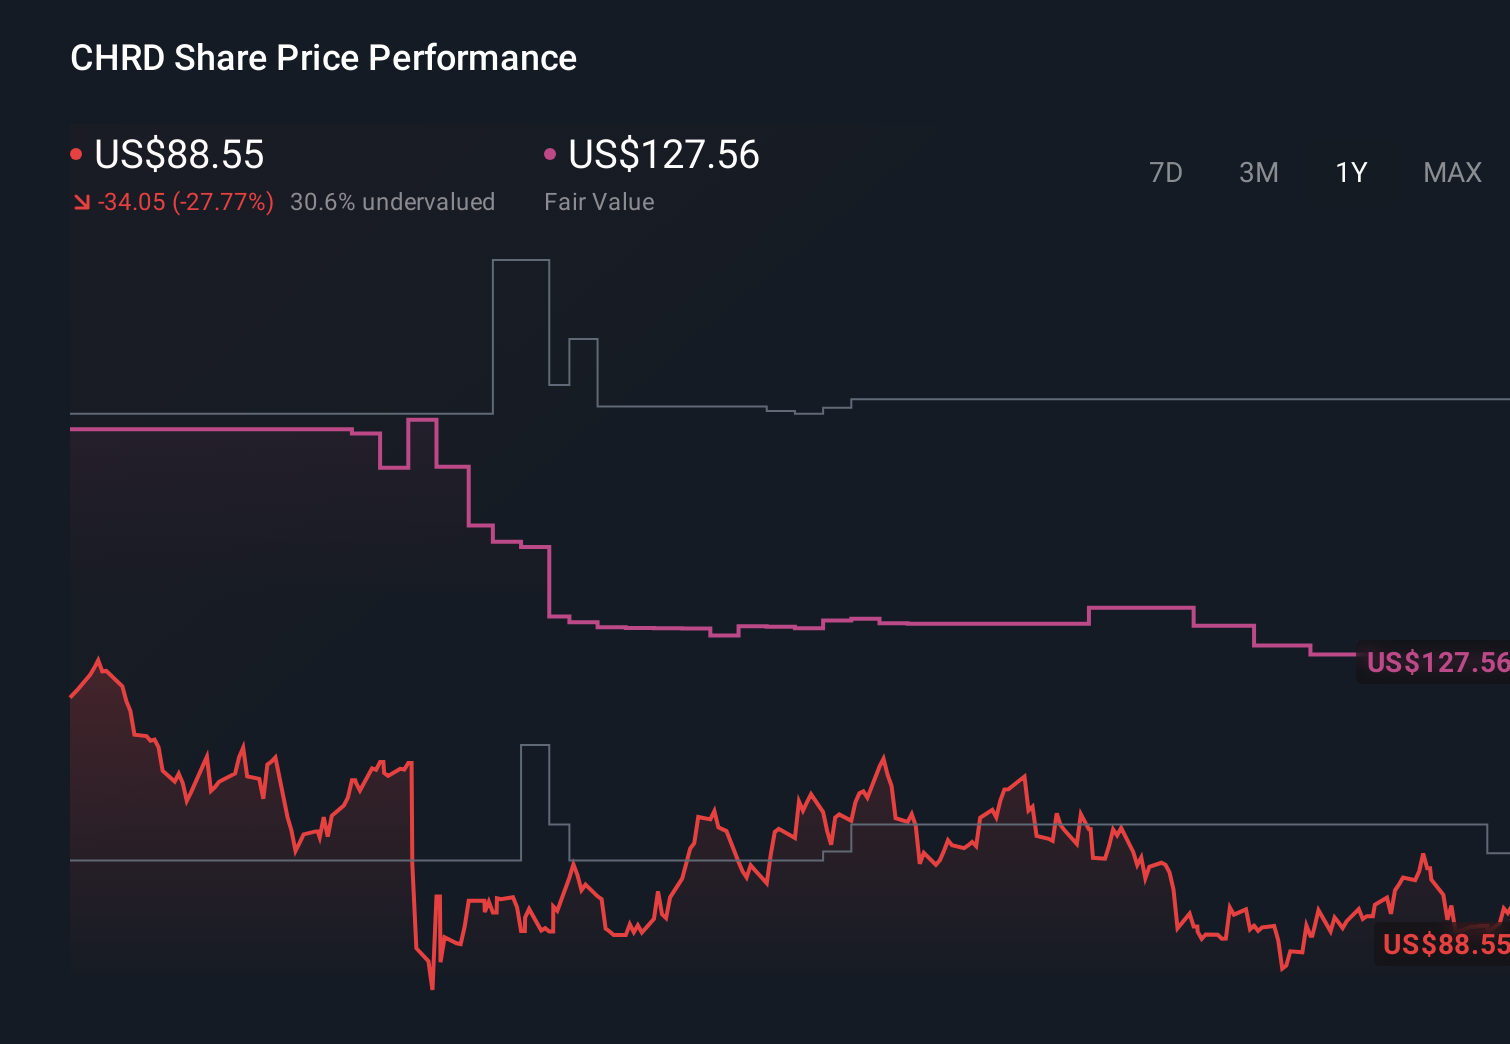 NasdaqGS:CHRD 1-Year Stock Price Chart
This article by Simply Wall St is general in nature. We provide commentary based on historical data
and analyst forecasts only using an unbiased methodology and our articles are not intended to be financial advice. It does not constitute a recommendation to buy or sell any stock, and does not take account of your objectives, or your
financial situation. We aim to bring you long-term focused analysis driven by fundamental data.
Note that our analysis may not factor in the latest price-sensitive company announcements or qualitative material.
Simply Wall St has no position in any stocks mentioned.
Our new AI Stock Screener scans the market every day to uncover opportunities.
• Dividend Powerhouses (3%+ Yield)
• Undervalued Small Caps with Insider Buying
• High growth Tech and AI Companies
Or build your own from over 50 metrics.
Have feedback on this article? Concerned about the content? Get in touch with us directly. Alternatively, email editorial-team@simplywallst.com