
Find out why Cactus’s -12.5% return over the last year is lagging behind its peers.
Approach 1: Cactus Discounted Cash Flow (DCF) Analysis
A Discounted Cash Flow, or DCF, model takes estimates of the cash a business could generate in the future and discounts those projections back to today, to arrive at an estimate of what the whole company might be worth now.
For Cactus, the model used is a 2 Stage Free Cash Flow to Equity approach based on cash flow projections. The latest twelve month Free Cash Flow is about $211.4 million. Analysts provide explicit forecasts for the next few years, and Simply Wall St then extrapolates further out, with total projected Free Cash Flow in 2035 of around $317.5 million.
When these projected cash flows are discounted back to today, the resulting estimated intrinsic value is US$81.29 per share. Compared with the recent share price of about US$51.37, the DCF output suggests the shares trade at a 36.8% discount to this estimate, which screens as undervalued on this model alone.
Result: UNDERVALUED
Our Discounted Cash Flow (DCF) analysis suggests Cactus is undervalued by 36.8%. Track this in your watchlist or portfolio, or discover 877 more undervalued stocks based on cash flows.
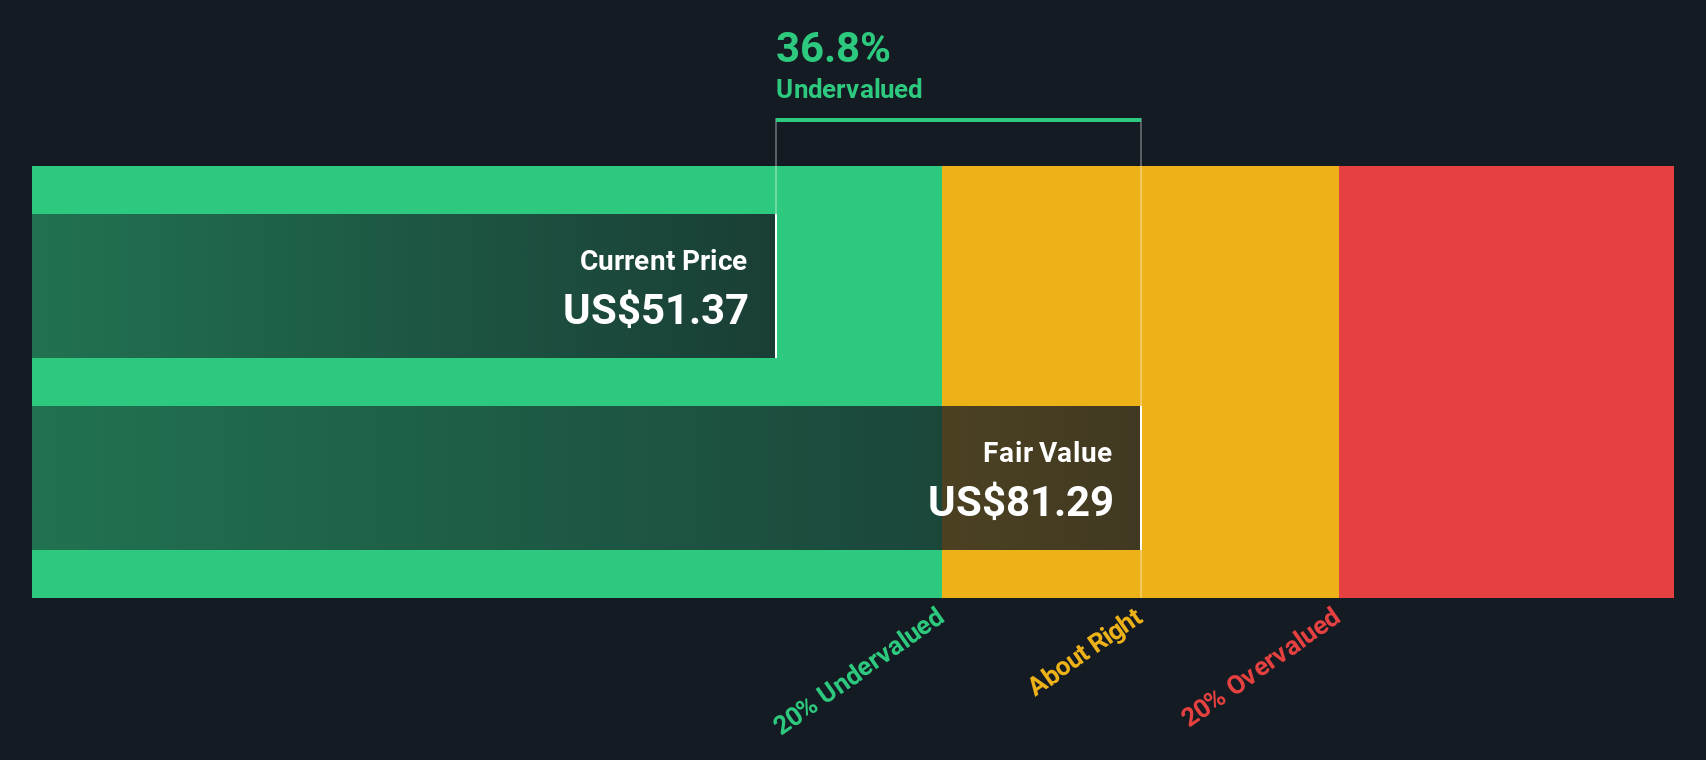 WHD Discounted Cash Flow as at Jan 2026
Approach 2: Cactus Price vs Earnings
For profitable companies like Cactus, the P/E ratio is a straightforward way to relate what you pay for each share to the earnings that support it. This is why it is often the first checkpoint investors use.
What counts as a reasonable P/E depends on how the market views a company’s growth prospects and risk profile. Higher expected growth or lower perceived risk can justify a higher P/E, while slower growth or higher risk usually points to a lower multiple being more appropriate.
Cactus currently trades on a P/E of 20.46x. That sits close to the Energy Services industry average of about 20.56x and below the peer group average of 39.64x, so on simple comparisons the shares do not screen as stretched.
Simply Wall St’s Fair Ratio for Cactus is 17.52x. This is a proprietary estimate of what the P/E might reasonably be, based on factors such as earnings growth, profit margins, industry, market cap and company specific risks. Because it blends these elements together, it can give you a more tailored benchmark than a broad industry or peer average.
Comparing the Fair Ratio of 17.52x with the current P/E of 20.46x suggests the shares screen as overvalued on this metric.
Result: OVERVALUED
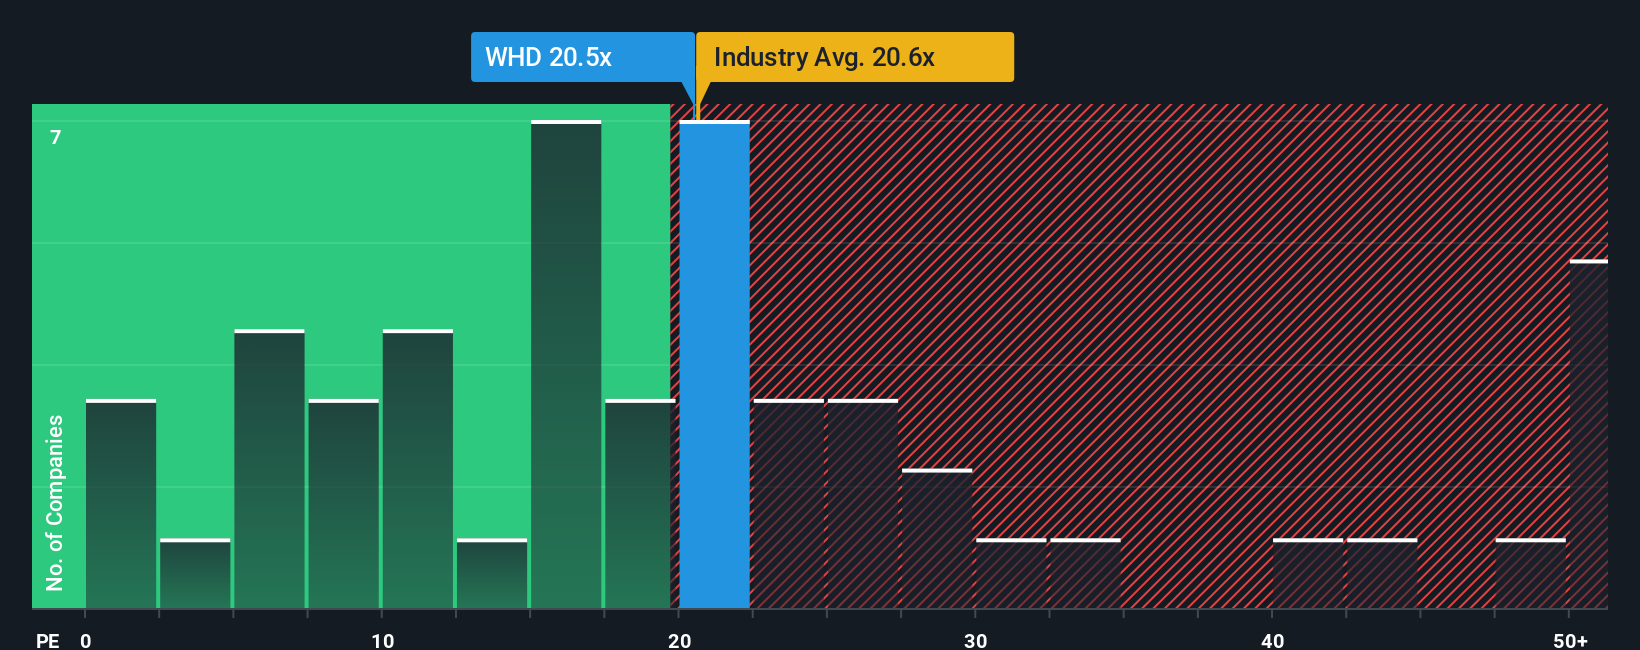 NYSE:WHD P/E Ratio as at Jan 2026
P/E ratios tell one story, but what if the real opportunity lies elsewhere? Discover 1445 companies where insiders are betting big on explosive growth.
Upgrade Your Decision Making: Choose your Cactus Narrative
Earlier we mentioned that there is an even better way to understand valuation, so let us introduce you to Narratives, a simple tool on Simply Wall St’s Community page that lets you set your own story for Cactus by linking your assumptions for future revenue, earnings, margins and fair value to the current price. It updates automatically as new news or earnings arrive, so you can compare your view with others. For example, one investor might see Cactus closer to US$56.00 because they focus on expansion, acquisitions and efficiency, while another might anchor nearer to US$39.00 because they focus more on risks around input costs, demand and industry shifts. This gives you a clear, numbers backed way to decide whether the current price of about US$51.37 looks higher or lower than the fair value that fits your own Narrative.
Do you think there’s more to the story for Cactus? Head over to our Community to see what others are saying!
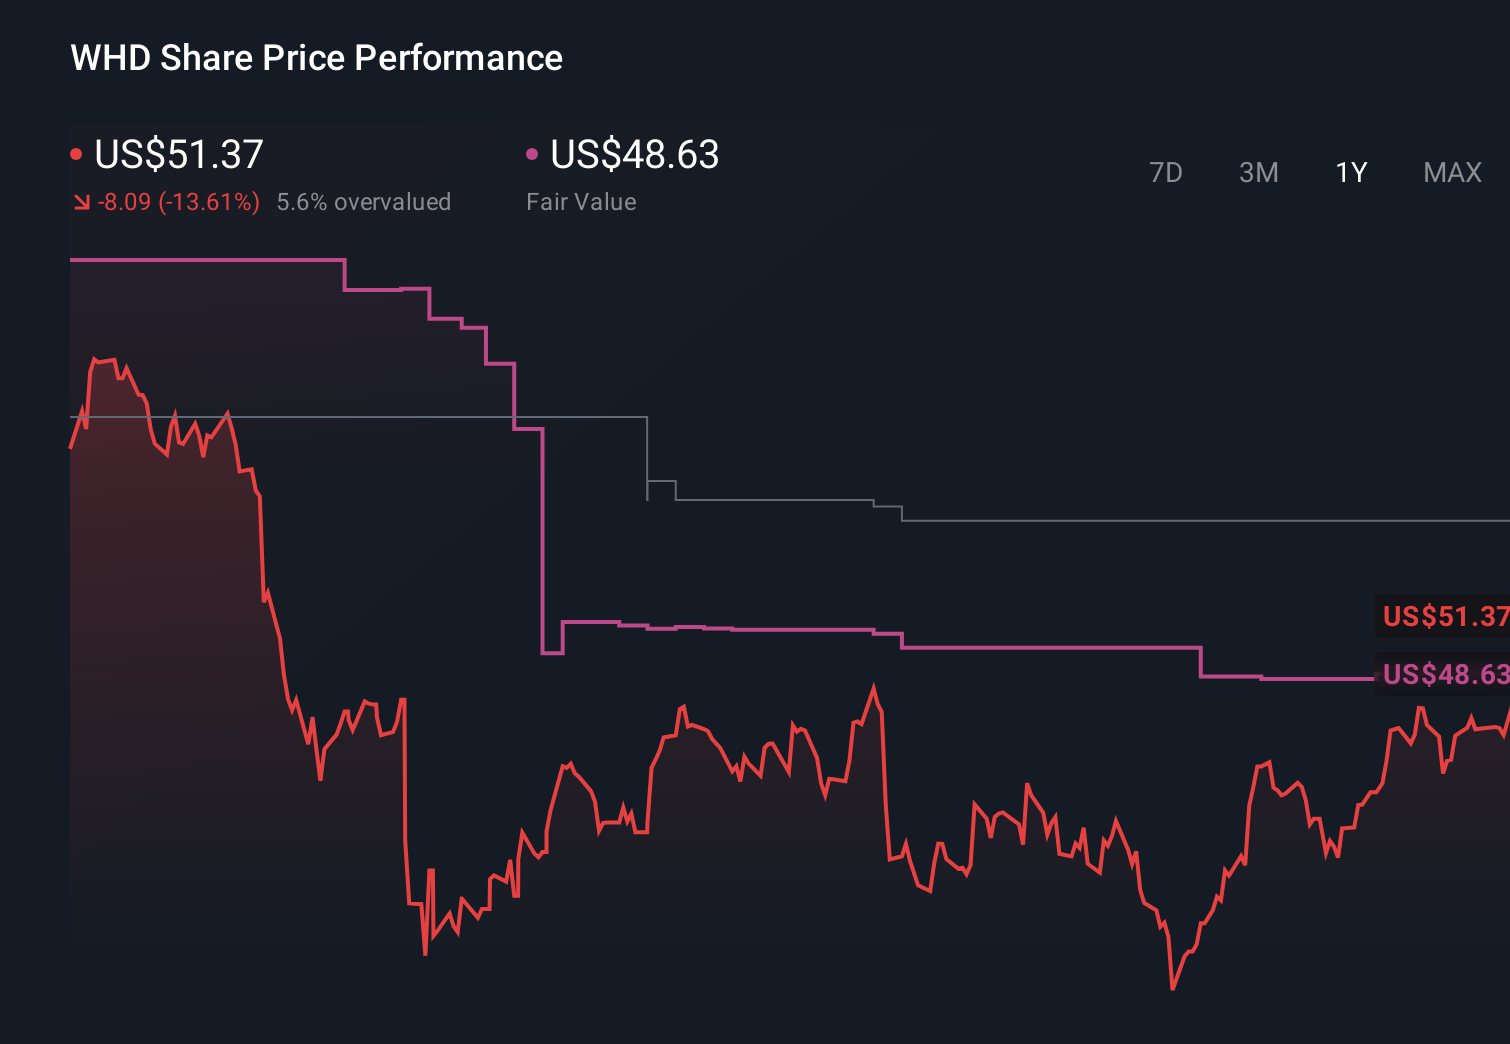 NYSE:WHD 1-Year Stock Price Chart
This article by Simply Wall St is general in nature. We provide commentary based on historical data
and analyst forecasts only using an unbiased methodology and our articles are not intended to be financial advice. It does not constitute a recommendation to buy or sell any stock, and does not take account of your objectives, or your
financial situation. We aim to bring you long-term focused analysis driven by fundamental data.
Note that our analysis may not factor in the latest price-sensitive company announcements or qualitative material.
Simply Wall St has no position in any stocks mentioned.
Our new AI Stock Screener scans the market every day to uncover opportunities.
• Dividend Powerhouses (3%+ Yield)
• Undervalued Small Caps with Insider Buying
• High growth Tech and AI Companies
Or build your own from over 50 metrics.
Have feedback on this article? Concerned about the content? Get in touch with us directly. Alternatively, email editorial-team@simplywallst.com