
Approach 1: Allstate Excess Returns Analysis
The Excess Returns model looks at how much value Allstate creates over and above the return that shareholders require, then capitalises those excess profits into a per share value.
For Allstate, book value is $97.34 per share and the stable book value estimate is $134.05 per share, based on weighted future book value estimates from 11 analysts. The model uses a stable EPS estimate of $25.62 per share, sourced from weighted future return on equity forecasts from the same group of analysts.
The cost of equity is set at $9.32 per share, so the implied excess return is $16.29 per share. That excess is supported by an average return on equity of 19.11%, which is higher than the return shareholders are assumed to require in this framework.
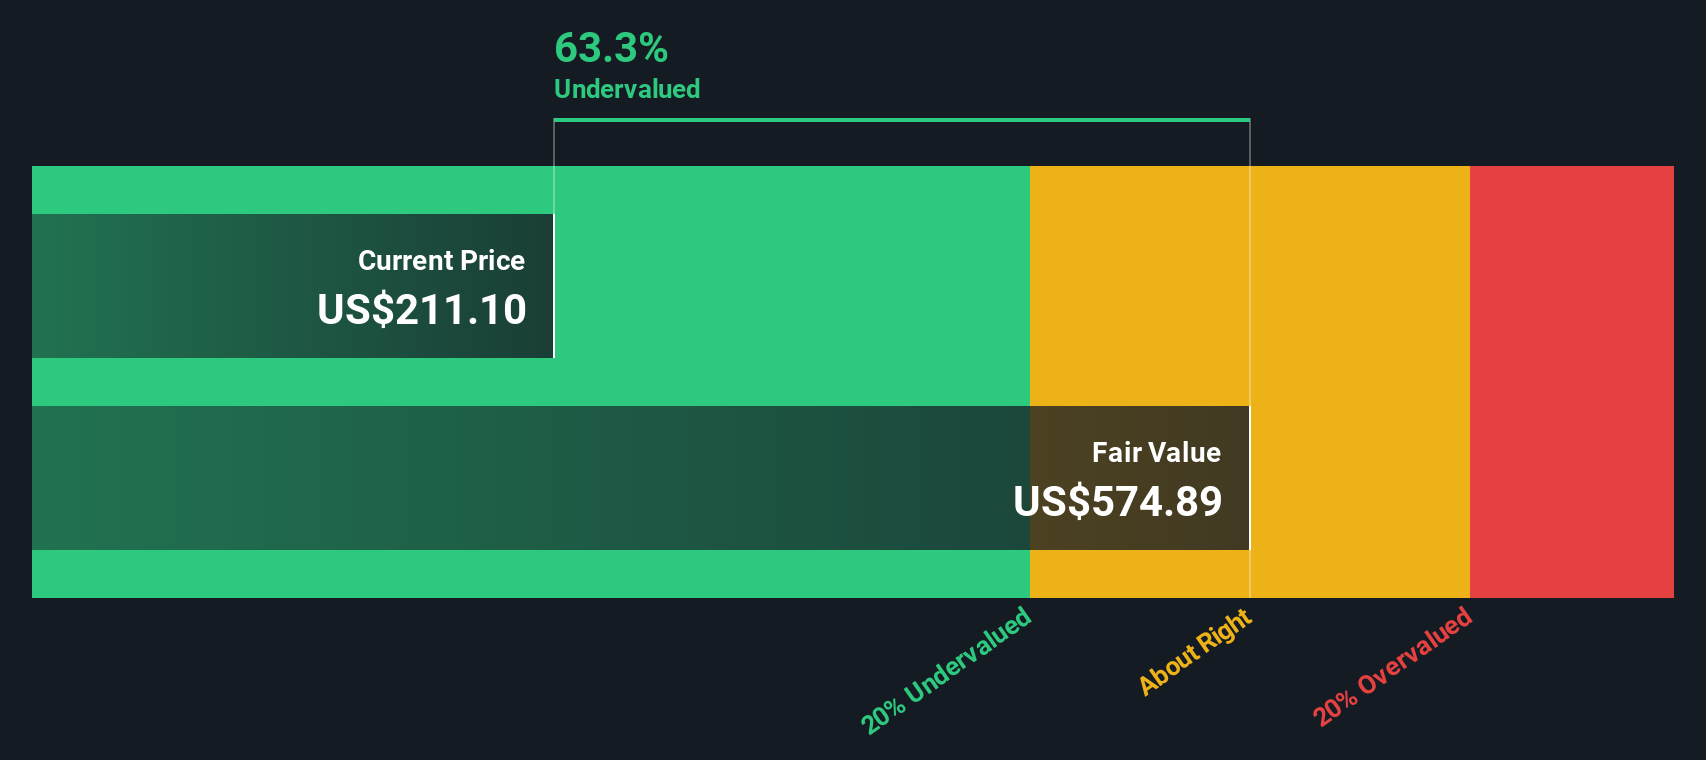
When these inputs are run through the Excess Returns model, Simply Wall St arrives at an intrinsic value of $574.89 per share. Compared with Allstate’s recent share price of $211.10, this output points to the stock trading at a 63.3% discount to that estimate, which is a wide gap.
Result: UNDERVALUED
Our Excess Returns analysis suggests Allstate is undervalued by 63.3%. Track this in your watchlist or portfolio, or discover 879 more undervalued stocks based on cash flows.
 ALL Discounted Cash Flow as at Jan 2026
Approach 2: Allstate Price vs Earnings
For a profitable company like Allstate, the P/E ratio is a useful shorthand for how much you are paying for each dollar of earnings. It ties directly to what many investors focus on, which is how earnings compare with the share price.
What counts as a “normal” P/E often reflects how quickly earnings are expected to grow and how risky those earnings appear. Higher expected growth or lower perceived risk can support a higher P/E, while lower growth or higher uncertainty usually lines up with a lower multiple.
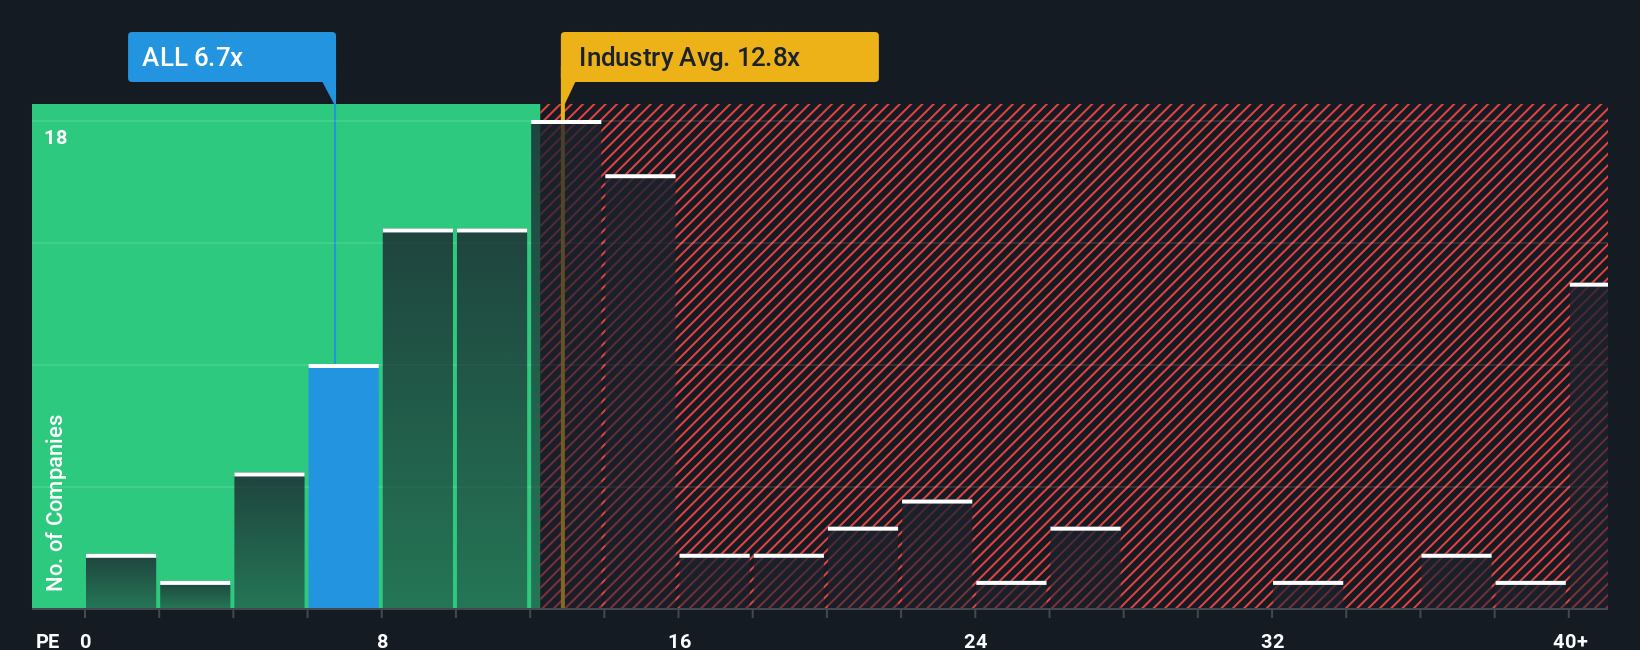
Allstate currently trades on a P/E of 6.69x. That sits below the Insurance industry average P/E of 12.80x and below the peer group average of 12.67x. Simply Wall St also calculates a proprietary Fair Ratio of 9.76x, which represents the P/E that might be expected given Allstate’s earnings profile, industry, profit margins, market value and risk characteristics.
The Fair Ratio is often more informative than a simple industry or peer comparison because it adjusts for company specific factors such as growth outlook, profitability, business risk and size. Comparing 6.69x with the Fair Ratio of 9.76x suggests Allstate’s shares are trading below that Fair Ratio.
Result: UNDERVALUED
 NYSE:ALL P/E Ratio as at Jan 2026
P/E ratios tell one story, but what if the real opportunity lies elsewhere? Discover 1444 companies where insiders are betting big on explosive growth.
Upgrade Your Decision Making: Choose your Allstate Narrative
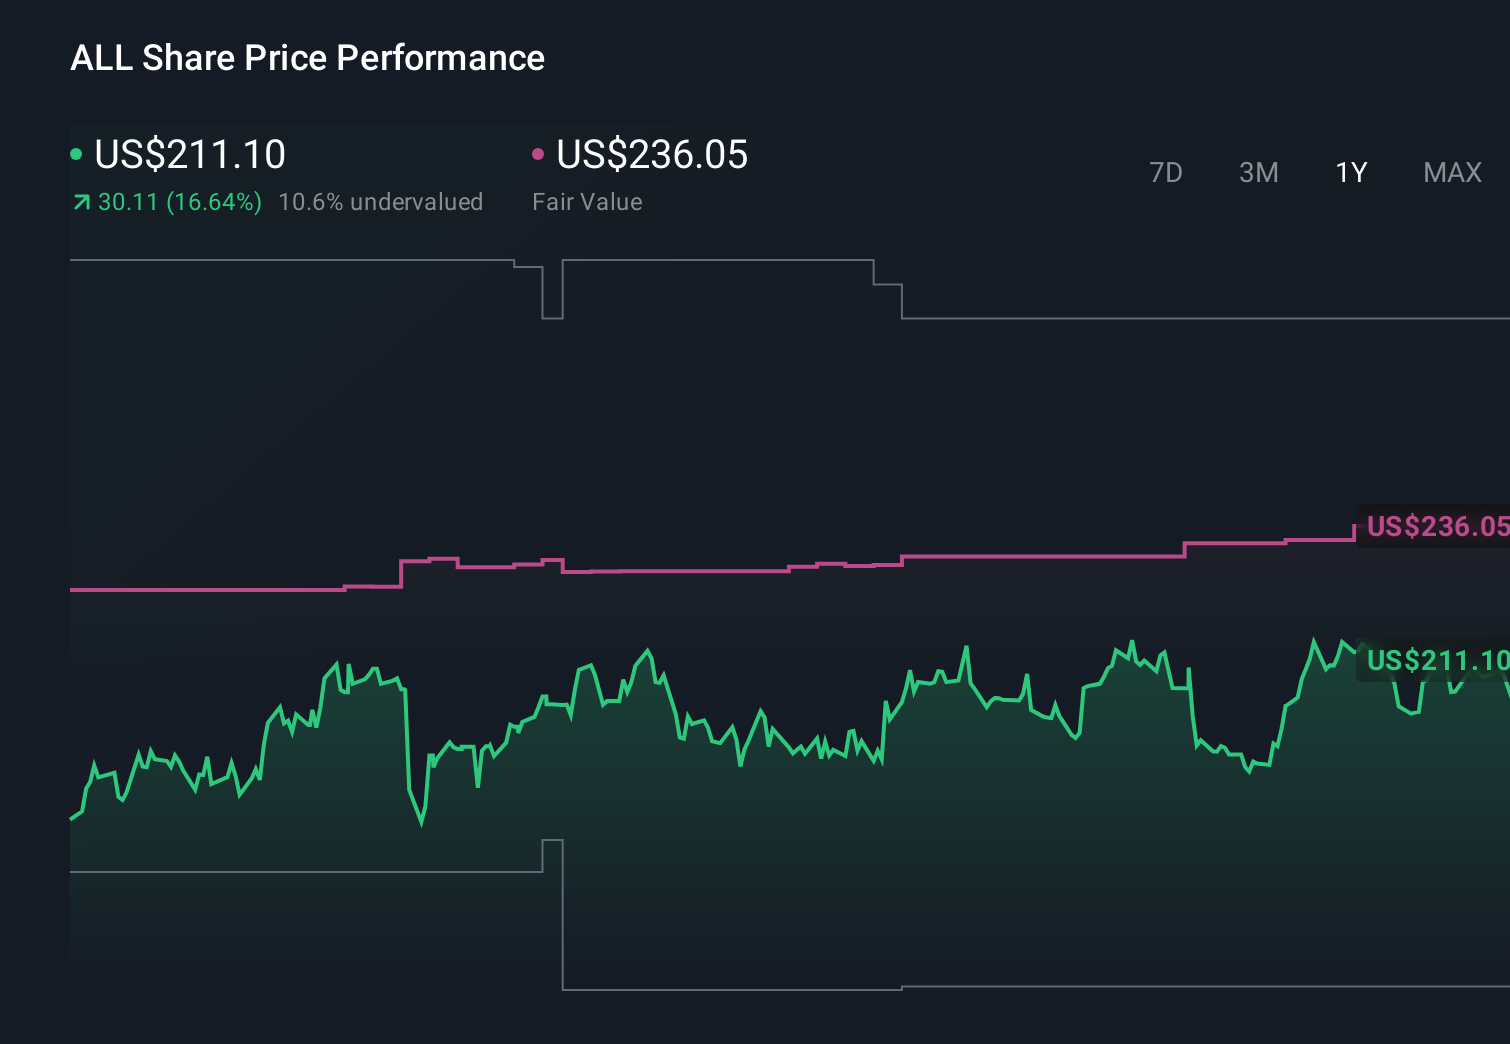
Earlier we mentioned that there is an even better way to think about valuation. Narratives let you attach a clear story about Allstate, including your assumptions for future revenue, earnings, margins and fair value, to a financial forecast that you can compare with the current share price on Simply Wall St’s Community page, where the tool is available to millions of investors. That story then updates automatically as new news or earnings arrive. You can see, for example, how one investor might build a more optimistic Allstate Narrative around higher margins and a fair value near US$236 per share, while another focuses on catastrophe losses, competition and regulatory constraints to support a more cautious view closer to US$157. Each Narrative helps its author decide whether the current market price looks high, low or roughly in line with their own fair value range.
Do you think there’s more to the story for Allstate? Head over to our Community to see what others are saying!
 NYSE:ALL 1-Year Stock Price Chart
This article by Simply Wall St is general in nature. We provide commentary based on historical data
and analyst forecasts only using an unbiased methodology and our articles are not intended to be financial advice. It does not constitute a recommendation to buy or sell any stock, and does not take account of your objectives, or your
financial situation. We aim to bring you long-term focused analysis driven by fundamental data.
Note that our analysis may not factor in the latest price-sensitive company announcements or qualitative material.
Simply Wall St has no position in any stocks mentioned.
We’ve created the ultimate portfolio companion for stock investors, and it’s free.
• Connect an unlimited number of Portfolios and see your total in one currency
• Be alerted to new Warning Signs or Risks via email or mobile
• Track the Fair Value of your stocks
Have feedback on this article? Concerned about the content? Get in touch with us directly. Alternatively, email editorial-team@simplywallst.com