
Virgin Galactic Holdings (SPCE) recently reworked its balance sheet by taking on higher interest debt and issuing new shares, a financing move aimed at reducing near term bankruptcy risk while raising additional cash.
See our latest analysis for Virgin Galactic Holdings.
The refinancing occurs against a weak share price backdrop, with a 30 day share price return showing an 11.45% decline and a 1 year total shareholder return showing a 45.44% loss. This suggests momentum has been fading even as the debt move aims to reduce near term financial risk.
If this kind of high risk turnaround story has your attention, it can also be useful to scan other aerospace names by checking out aerospace and defense stocks.
With Virgin Galactic reporting revenue of just US$1.66 million against a net loss of US$292.60 million and a value score of 4, plus a large discount to some analyst targets, you have to ask: is this a rare entry point, or is the market already assuming all the future growth that matters?
Price to Book of 0.9x: Is It Justified?
On a basic yardstick, Virgin Galactic looks inexpensive, with a P/B of 0.9x at a last close of US$3.17, while still carrying heavy losses and financing risk.
P/B compares the share price to the company’s net assets on the balance sheet. This ratio matters a lot for capital-intensive names like aerospace and space travel.
Here, the P/B of 0.9x is materially below the peer average of 3x and the broader US Aerospace and Defense average of 4x. This implies the market is pricing Virgin Galactic’s assets at a discount to many competitors despite forecasts for revenue growth and an expectation that earnings could improve over time.
That discount is wide compared to sector norms and suggests investors are currently placing a far lower value on each dollar of book equity than they do for the typical aerospace and defense stock.
See what the numbers say about this price — find out in our valuation breakdown.
Result: Price-to-book of 0.9x (UNDERVALUED)
However, you are still looking at a company with a US$292.60 million loss and multi year share price declines, so execution setbacks or financing pressure could quickly challenge any value case.
Find out about the key risks to this Virgin Galactic Holdings narrative.
Another View: Our DCF Model Paints A Very Different Picture
While the 0.9x P/B suggests a discount, our DCF model points in the opposite direction in terms of scale, with Virgin Galactic trading about 95% below an estimated fair value of US$64.16 per share. If both are using the same facts, which one would you lean on?
Look into how the SWS DCF model arrives at its fair value.
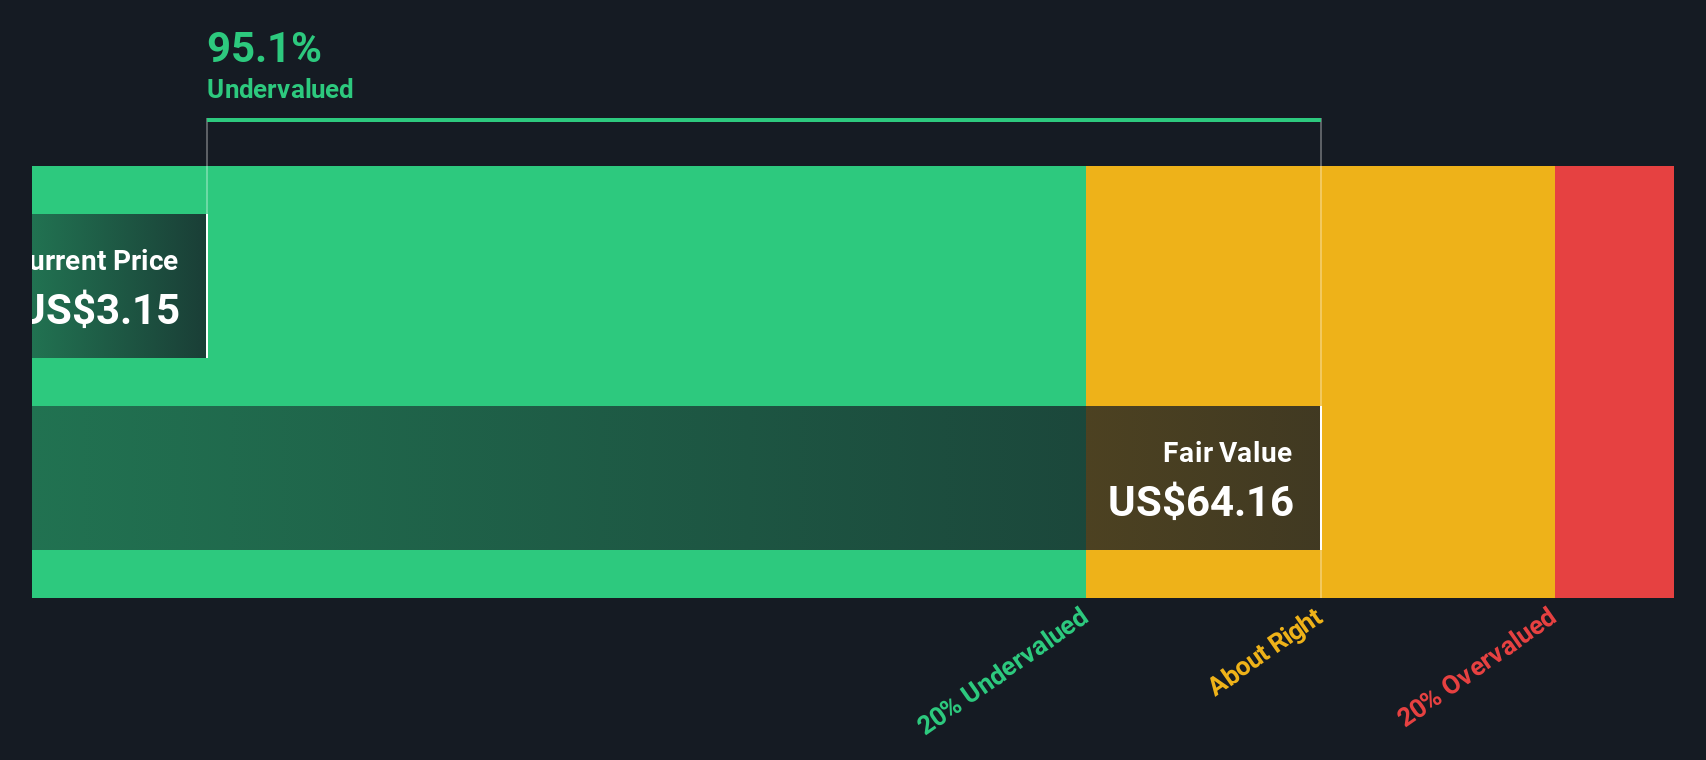 SPCE Discounted Cash Flow as at Jan 2026
Simply Wall St performs a discounted cash flow (DCF) on every stock in the world every day (check out Virgin Galactic Holdings for example). We show the entire calculation in full. You can track the result in your watchlist or portfolio and be alerted when this changes, or use our stock screener to discover 879 undervalued stocks based on their cash flows. If you save a screener we even alert you when new companies match – so you never miss a potential opportunity.
Build Your Own Virgin Galactic Holdings Narrative
If you see the numbers differently or want to stress test your own assumptions, you can build a complete narrative around the same data in just a few minutes, starting with Do it your way.
A great starting point for your Virgin Galactic Holdings research is our analysis highlighting 3 key rewards and 3 important warning signs that could impact your investment decision.
Looking for more investment ideas?
If you are serious about sharpening your stock picks, now is the time to scan wider and see what else the market might be overlooking.
This article by Simply Wall St is general in nature. We provide commentary based on historical data
and analyst forecasts only using an unbiased methodology and our articles are not intended to be financial advice. It does not constitute a recommendation to buy or sell any stock, and does not take account of your objectives, or your
financial situation. We aim to bring you long-term focused analysis driven by fundamental data.
Note that our analysis may not factor in the latest price-sensitive company announcements or qualitative material.
Simply Wall St has no position in any stocks mentioned.
We’ve created the ultimate portfolio companion for stock investors, and it’s free.
• Connect an unlimited number of Portfolios and see your total in one currency
• Be alerted to new Warning Signs or Risks via email or mobile
• Track the Fair Value of your stocks
Have feedback on this article? Concerned about the content? Get in touch with us directly. Alternatively, email editorial-team@simplywallst.com