
Mercury General (MCY) has drawn fresh attention after its recent trading performance, with the share price around $89.69 and return figures that vary widely between the past month, past 3 months, and longer periods.
See our latest analysis for Mercury General.
At a recent share price of US$89.69, Mercury General’s short term share price performance has softened slightly, but its 90 day share price return of 11.92% and 1 year total shareholder return of 87.84% point to momentum that has built over a longer stretch.
If Mercury General’s move has caught your eye, this can be a useful moment to broaden your watchlist. You could use fast growing stocks with high insider ownership to identify additional potential future candidates.
With a recent US$89.69 share price, a 12% discount to the US$100 analyst target and a mixed record across shorter timeframes, you have to ask: is Mercury General still undervalued, or is the market already pricing in future growth?
Most Popular Narrative: 10.3% Undervalued
Compared with the recent US$89.69 share price, the most followed narrative points to a higher fair value of US$100, anchored on specific earnings and margin assumptions.
The analysts have a consensus price target of $90.0 for Mercury General based on their expectations of its future earnings growth, profit margins and other risk factors. In order for you to agree with the analyst’s consensus, you’d need to believe that by 2028, revenues will be $6.7 billion, earnings will come to $452.5 million, and it would be trading on a PE ratio of 13.3x, assuming you use a discount rate of 6.8%.
Curious how steady revenue growth, unchanged margins and a higher future P/E can still support a premium to today’s price? The full narrative spells out the earnings path, valuation bridge and discount rate math that link Mercury General’s current auto and homeowners business to that US$100 fair value.
Result: Fair Value of $100 (UNDERVALUED)
Have a read of the narrative in full and understand what’s behind the forecasts.
However, the narrative could easily be challenged if wildfire related catastrophe losses escalate or if reinsurance costs rise further and squeeze those assumed steady margins.
Find out about the key risks to this Mercury General narrative.
Another View: SWS DCF Model Points To A Premium
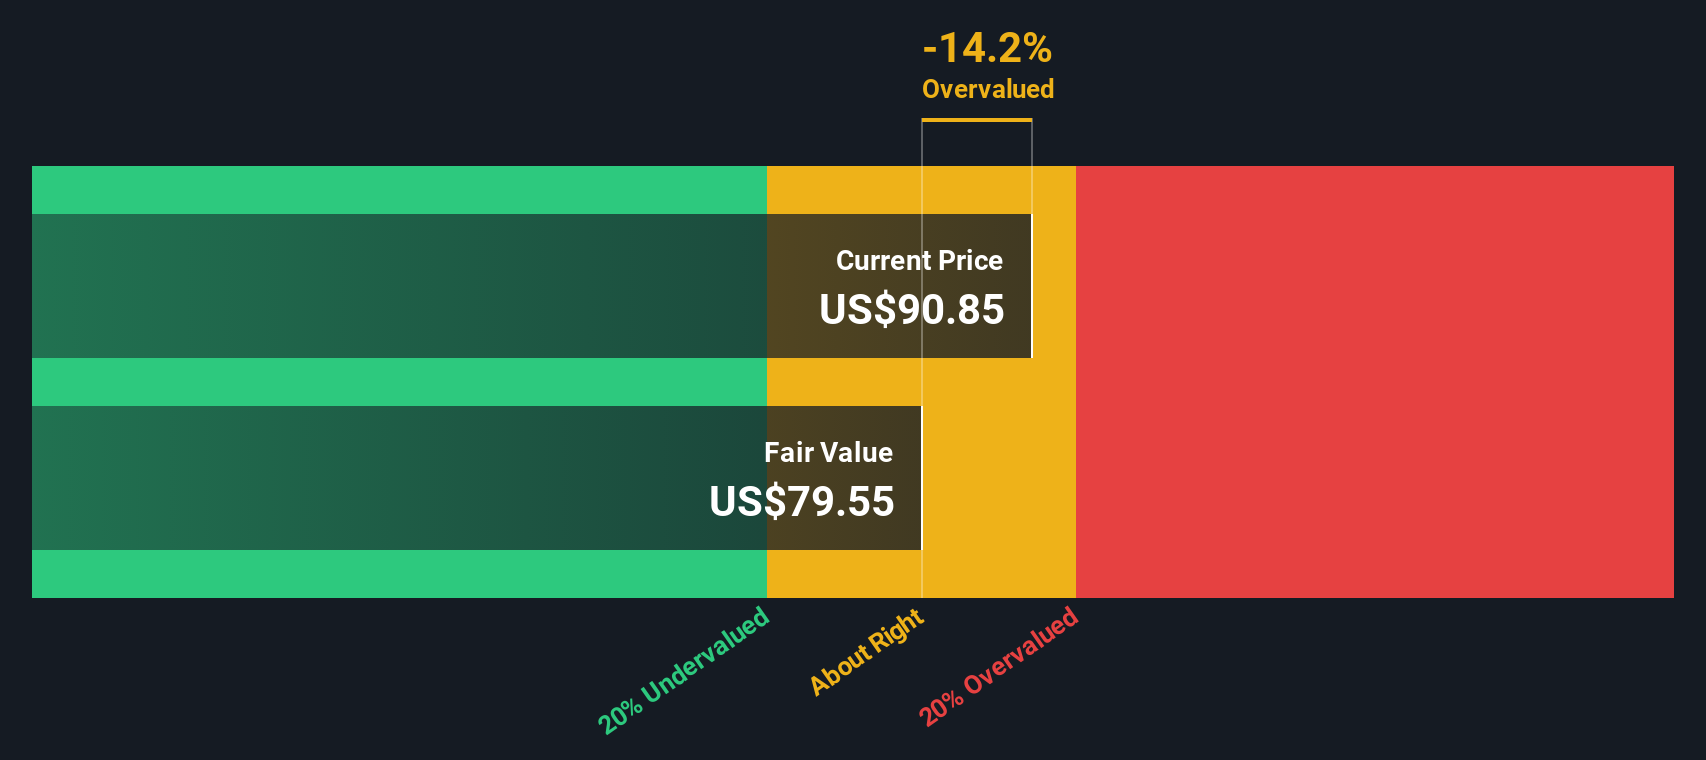
The analyst narrative leans on earnings assumptions and a higher future P/E to suggest Mercury General looks around 10% undervalued at US$89.69. Our DCF model tells a different story, with an estimated fair value of US$79.55, which implies the shares trade at a premium instead.
That gap between a narrative driven fair value of US$100 and a DCF fair value of US$79.55 raises a simple question for you as an investor: which set of assumptions feels closer to how you see Mercury General’s long term cash generation?
Look into how the SWS DCF model arrives at its fair value.
 MCY Discounted Cash Flow as at Jan 2026
Simply Wall St performs a discounted cash flow (DCF) on every stock in the world every day (check out Mercury General for example). We show the entire calculation in full. You can track the result in your watchlist or portfolio and be alerted when this changes, or use our stock screener to discover 879 undervalued stocks based on their cash flows. If you save a screener we even alert you when new companies match – so you never miss a potential opportunity.
Build Your Own Mercury General Narrative
If you look at the numbers and reach a different conclusion, or simply want to test your own assumptions, you can quickly build a custom view of Mercury General and shape a narrative that fits how you see the stock, all in just a few minutes, Do it your way.
A great starting point for your Mercury General research is our analysis highlighting 2 key rewards and 2 important warning signs that could impact your investment decision.
Looking for more investment ideas?
If Mercury General is on your radar, do not stop there. Use this momentum to scout a few more angles that could sharpen your next move.
This article by Simply Wall St is general in nature. We provide commentary based on historical data
and analyst forecasts only using an unbiased methodology and our articles are not intended to be financial advice. It does not constitute a recommendation to buy or sell any stock, and does not take account of your objectives, or your
financial situation. We aim to bring you long-term focused analysis driven by fundamental data.
Note that our analysis may not factor in the latest price-sensitive company announcements or qualitative material.
Simply Wall St has no position in any stocks mentioned.
We’ve created the ultimate portfolio companion for stock investors, and it’s free.
• Connect an unlimited number of Portfolios and see your total in one currency
• Be alerted to new Warning Signs or Risks via email or mobile
• Track the Fair Value of your stocks
Have feedback on this article? Concerned about the content? Get in touch with us directly. Alternatively, email editorial-team@simplywallst.com