
NIO scores just 2/6 on our valuation checks. See what other red flags we found in the full valuation breakdown.
Approach 1: NIO Discounted Cash Flow (DCF) Analysis
A Discounted Cash Flow, or DCF, model estimates what a company could be worth by projecting its future cash flows and then discounting those back to today to reflect the time value of money and risk.
For NIO, the model used is a 2 Stage Free Cash Flow to Equity approach, based on cash flows in CN¥. The latest twelve month free cash flow (FCF) figure is a loss of CN¥19,679.27m. Analyst inputs and extrapolations then project FCF through to 2035, with the 2030 FCF projection at CN¥9,666m and later years based on estimated growth rates provided by Simply Wall St.
When all those projected cash flows are discounted back and summed, the model arrives at an intrinsic value of about US$4.87 per share, compared with the current share price of around US$4.64. That implies the shares trade at roughly a 4.7% discount to this DCF estimate, which is a small gap and well within a reasonable margin of error for this kind of model.
Result: ABOUT RIGHT
NIO is fairly valued according to our Discounted Cash Flow (DCF), but this can change at a moment’s notice. Track the value in your watchlist or portfolio and be alerted on when to act.
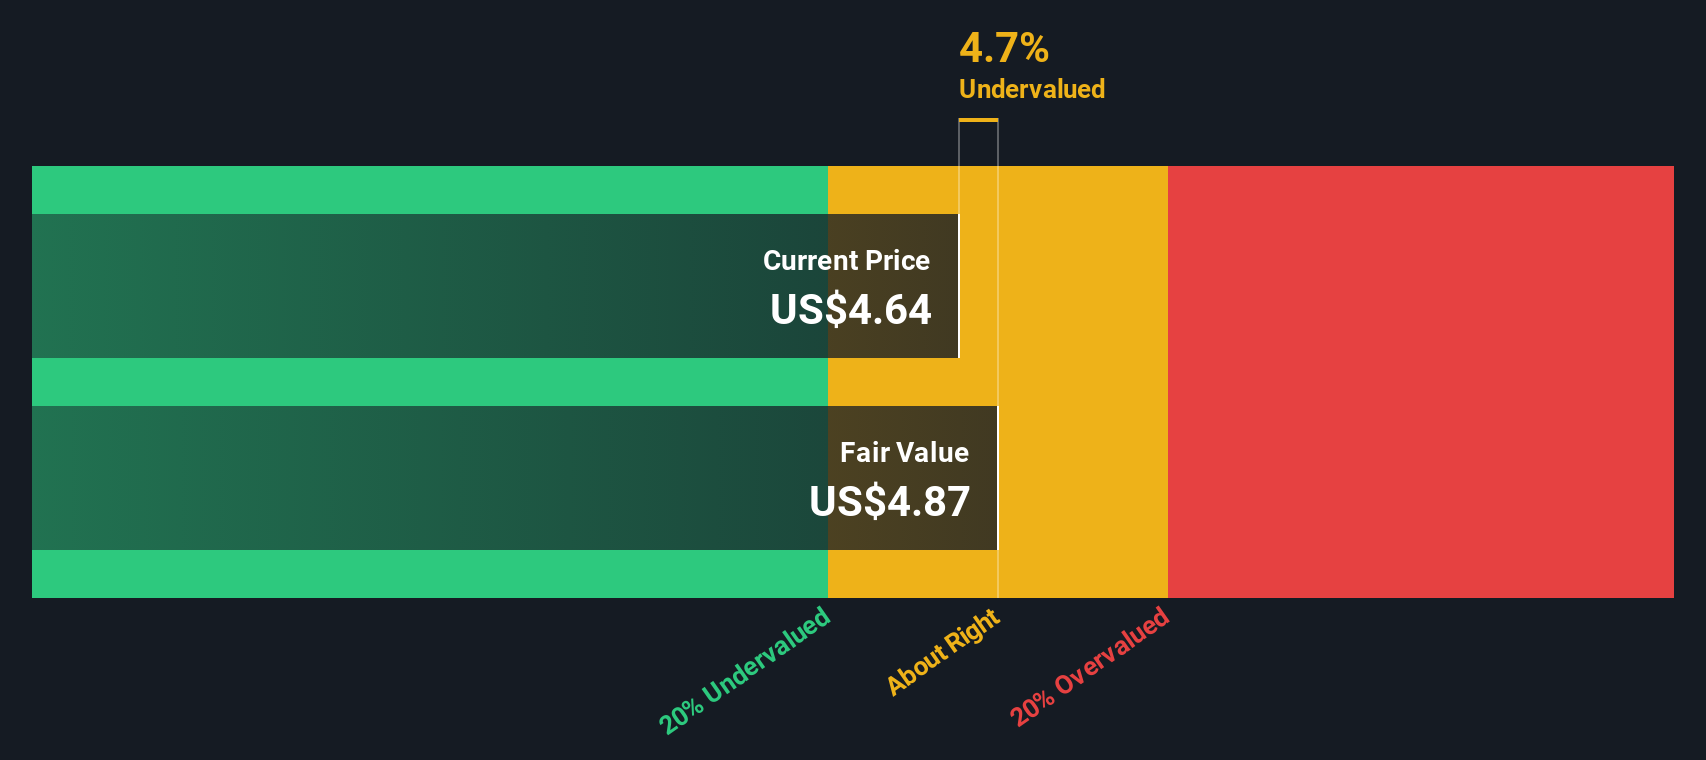 NIO Discounted Cash Flow as at Jan 2026
Approach 2: NIO Price vs Sales
For companies where earnings are weak or volatile, the P/S ratio is often more useful than P/E, because it looks at what investors are paying for each dollar of revenue rather than profit. Growth expectations and risk still matter, since faster and riskier companies can justify a wider range of normal multiples, but P/S gives you a cleaner anchor when profits are not yet consistent.
NIO currently trades on a P/S of 1.13x. That sits above the Auto industry average P/S of 0.60x, yet below the peer group average of 2.57x. To sharpen this view, Simply Wall St uses a proprietary Fair Ratio that estimates what P/S might be reasonable for NIO given factors such as its earnings growth profile, industry, profit margins, market cap and specific risks. Because it is tailored to the company, this Fair Ratio can be more informative than a simple comparison against broad industry or peer averages.
For NIO, the Fair Ratio is 1.05x, which is close to the current 1.13x P/S. The gap is small, so the shares look priced roughly in line with what this framework suggests.
Result: ABOUT RIGHT
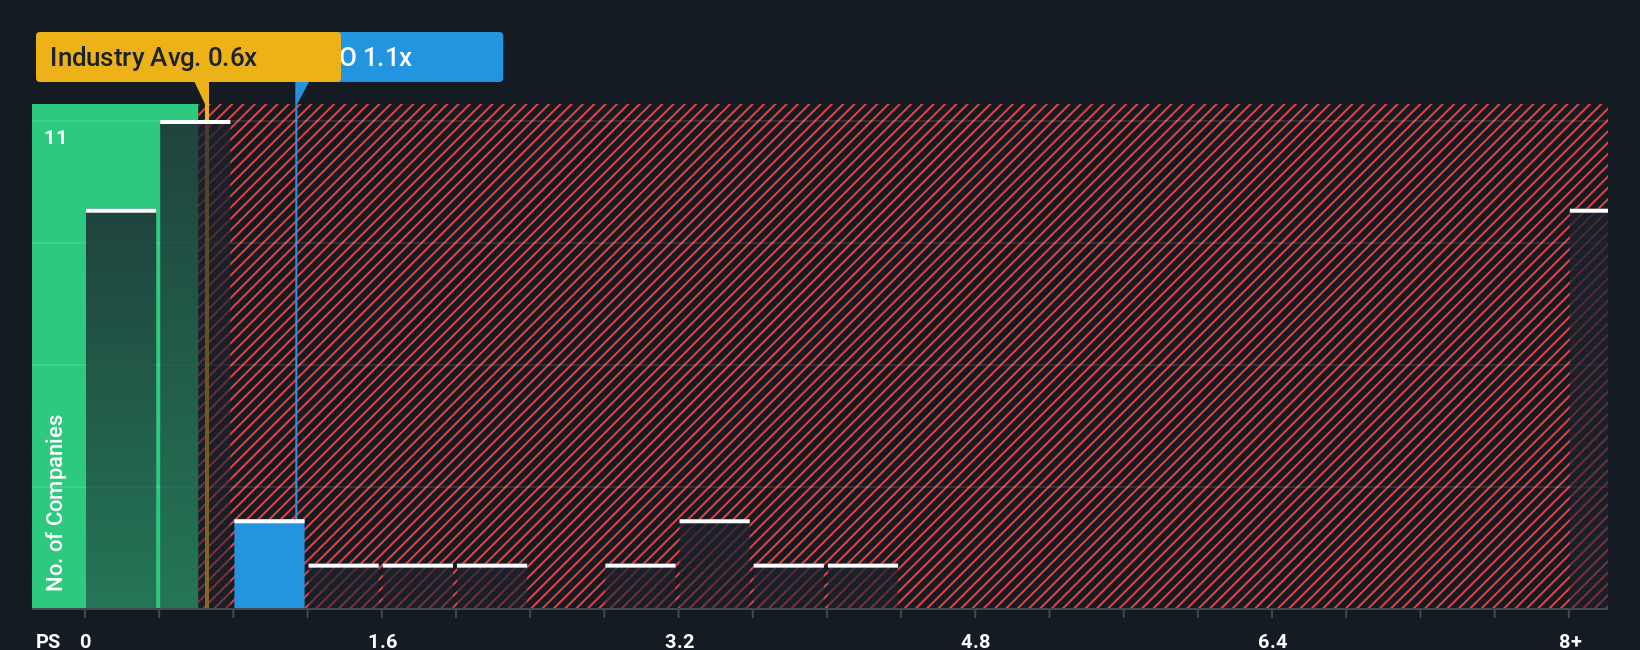 NYSE:NIO P/S Ratio as at Jan 2026
P/S ratios tell one story, but what if the real opportunity lies elsewhere? Discover 1444 companies where insiders are betting big on explosive growth.
Upgrade Your Decision Making: Choose your NIO Narrative
Earlier we mentioned that there is an even better way to understand valuation. Narratives let you attach your own story about NIO to the numbers by linking your view of its future revenue, earnings and margins to a financial forecast, a fair value, and then a clear comparison of that fair value to today’s price. This all happens within an easy Community tool on Simply Wall St that updates as new news or earnings arrive. For example, one Narrative might lean toward the higher US$9.00 target with confidence in chip licensing and new models, while another might sit closer to the US$3.00 view with more focus on competition and execution risks. You can use those different perspectives to decide what price you are comfortable paying, or accepting if you already hold the stock.
Do you think there’s more to the story for NIO? Head over to our Community to see what others are saying!
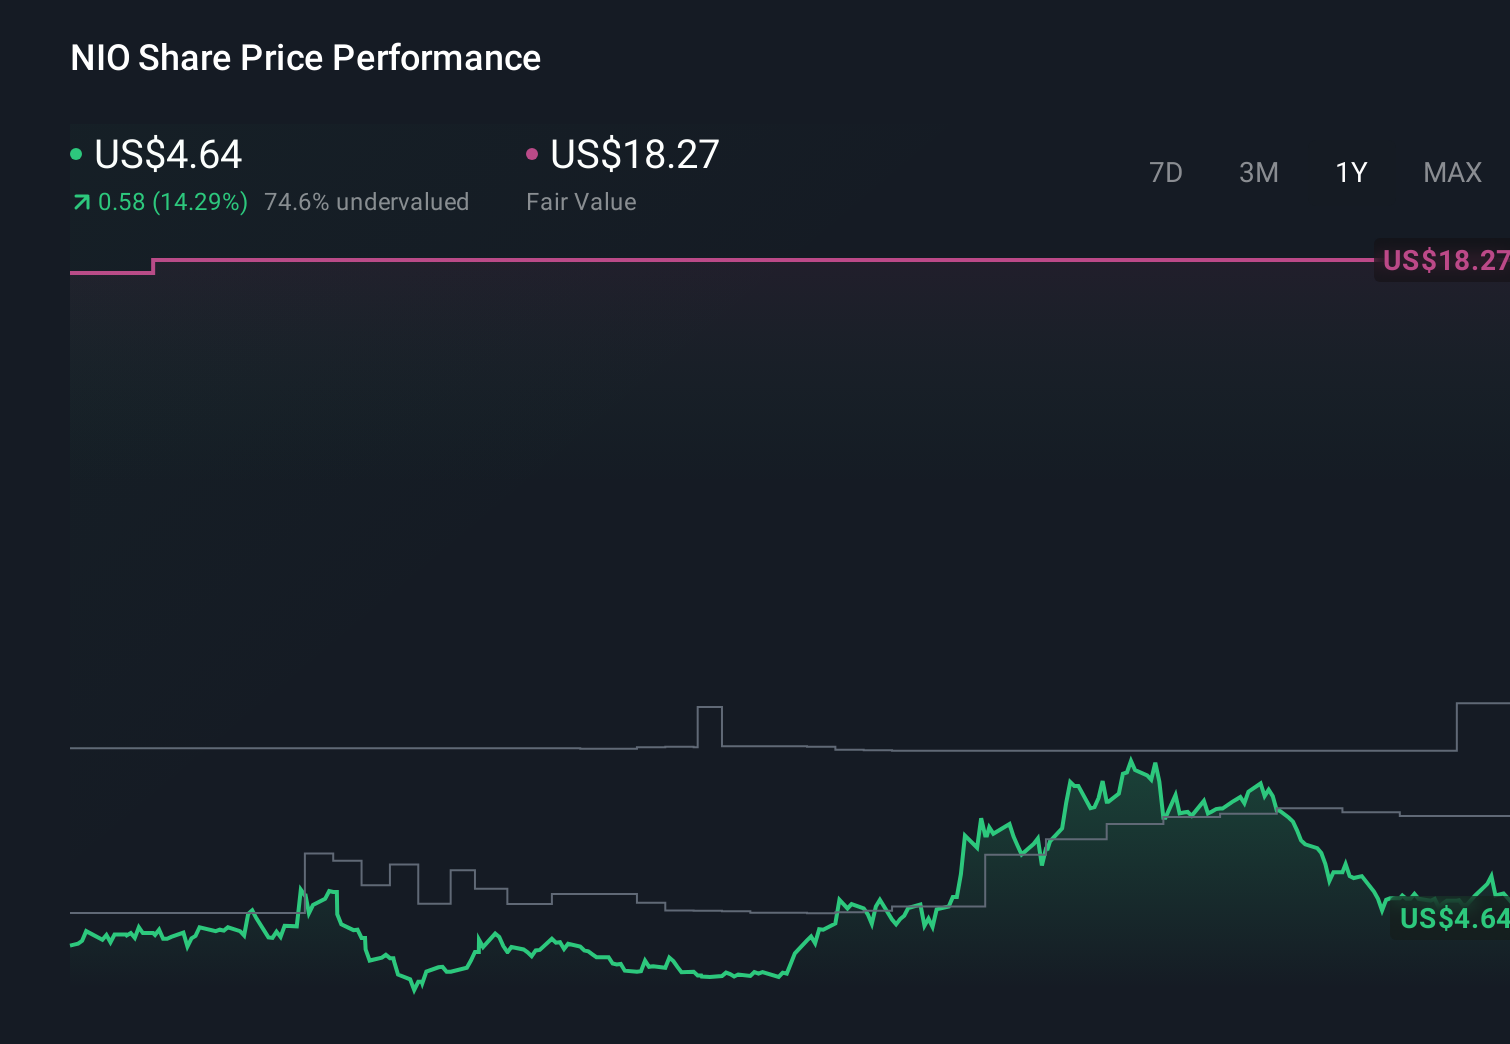 NYSE:NIO 1-Year Stock Price Chart
This article by Simply Wall St is general in nature. We provide commentary based on historical data
and analyst forecasts only using an unbiased methodology and our articles are not intended to be financial advice. It does not constitute a recommendation to buy or sell any stock, and does not take account of your objectives, or your
financial situation. We aim to bring you long-term focused analysis driven by fundamental data.
Note that our analysis may not factor in the latest price-sensitive company announcements or qualitative material.
Simply Wall St has no position in any stocks mentioned.
Discover if NIO might be undervalued or overvalued with our detailed analysis, featuring fair value estimates, potential risks, dividends, insider trades, and its financial condition.
Have feedback on this article? Concerned about the content? Get in touch with us directly. Alternatively, email editorial-team@simplywallst.com