
Approach 1: Illumina Discounted Cash Flow (DCF) Analysis
A Discounted Cash Flow, or DCF, model estimates what a company could be worth today by projecting its future cash flows and then discounting those back into present value using a required rate of return.
For Illumina, the model used is a 2 Stage Free Cash Flow to Equity approach, based on cash flow projections in $. The last twelve months free cash flow is about $896.3 million. Analyst input covers the earlier years, and Simply Wall St extrapolates the later years, with projected free cash flow in 2035 of about $1.83 billion, discounted to $844.4 million in today’s terms.
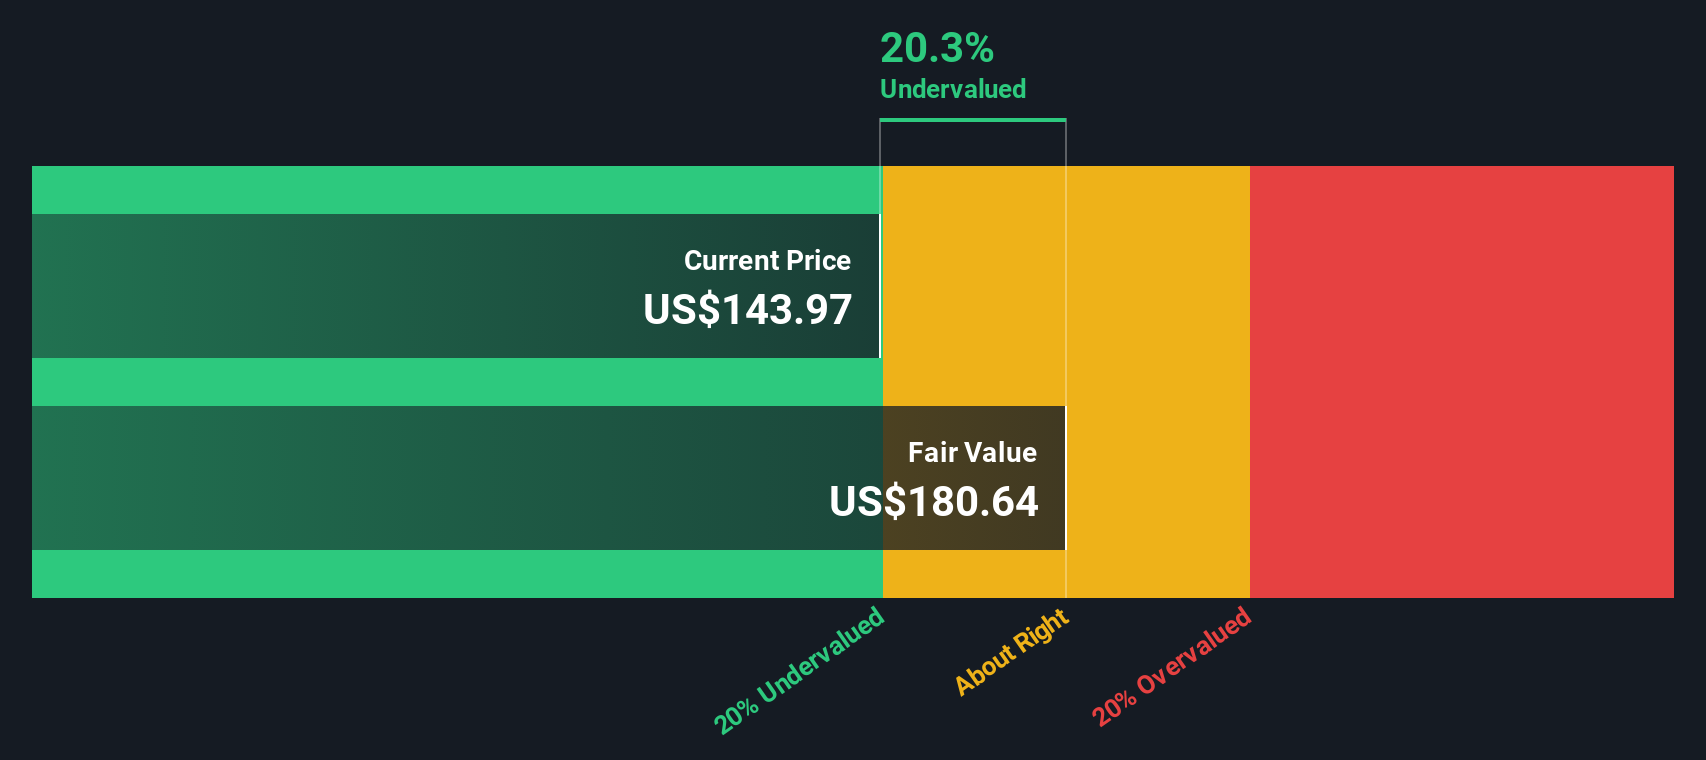
Pulling all projected and discounted cash flows together, the model arrives at an estimated intrinsic value of US$180.48 per share. Compared to the recent share price of US$145.30, this implies the stock trades at roughly a 19.5% discount. On this cash flow view, it currently screens as undervalued.
Result: UNDERVALUED
Our Discounted Cash Flow (DCF) analysis suggests Illumina is undervalued by 19.5%. Track this in your watchlist or portfolio, or discover 868 more undervalued stocks based on cash flows.
 ILMN Discounted Cash Flow as at Jan 2026
Approach 2: Illumina Price vs Earnings
For a profitable company like Illumina, the P/E ratio is a useful way to relate what you are paying per share to the earnings the business is currently generating. It is a quick sense check of how many years of current earnings the market is pricing into the stock.
What counts as a normal or fair P/E will usually reflect how the market views a company’s growth potential and risk. Higher expected growth or lower perceived risk can justify a higher multiple, while slower growth or higher risk typically points to a lower one.
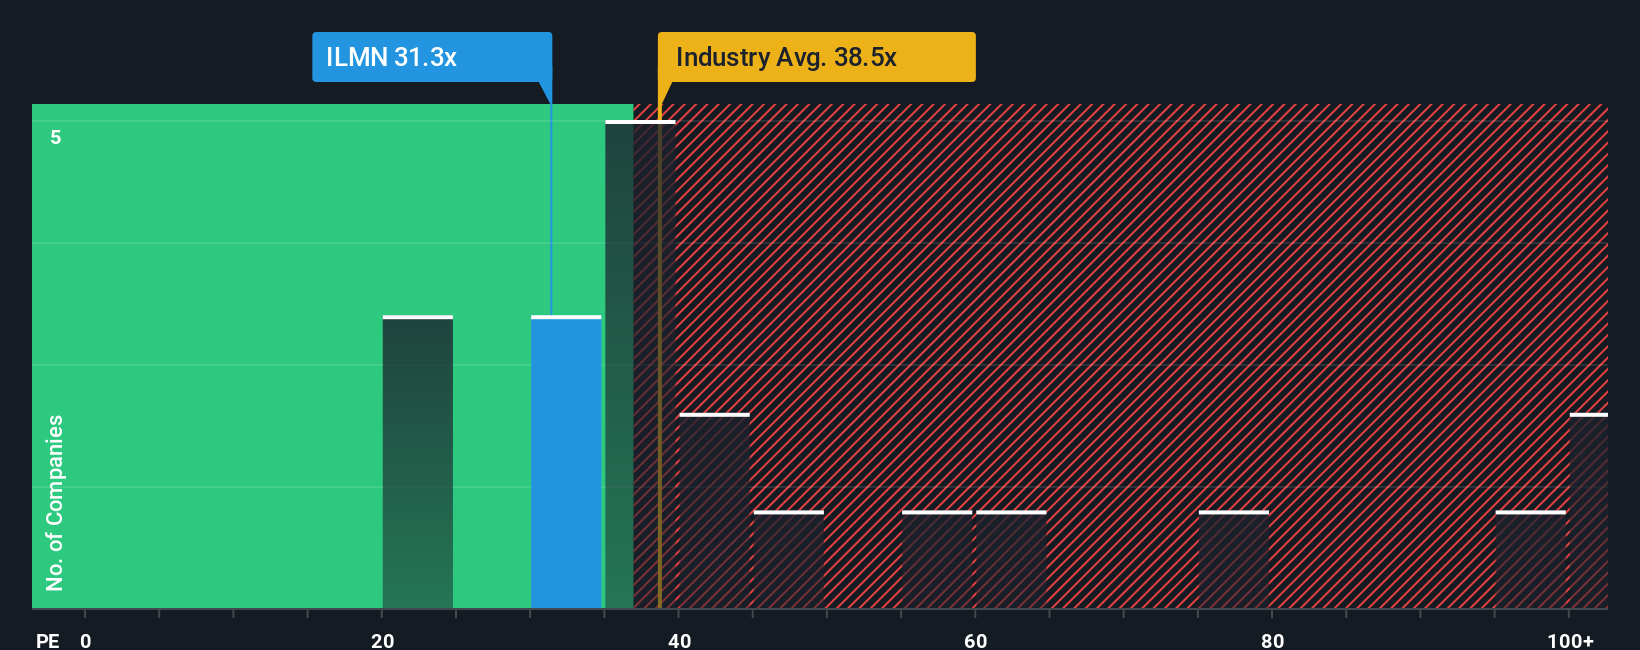
Illumina currently trades on a P/E of 31.58x. That sits below the Life Sciences industry average of 38.54x and also below the peer average of 34.23x. Simply Wall St’s Fair Ratio for Illumina is 23.72x, which is its proprietary view of what the P/E could be given factors like earnings growth, profit margins, industry, market cap and risk profile. This Fair Ratio can be more tailored than a simple comparison with peers or the broad industry because it adjusts for Illumina specific characteristics rather than assuming all companies deserve similar multiples.
Comparing the current 31.58x P/E with the Fair Ratio of 23.72x suggests the shares trade above that tailored benchmark.
Result: OVERVALUED
 NasdaqGS:ILMN P/E Ratio as at Jan 2026
P/E ratios tell one story, but what if the real opportunity lies elsewhere? Discover 1440 companies where insiders are betting big on explosive growth.
Upgrade Your Decision Making: Choose your Illumina Narrative
Earlier we mentioned that there is an even better way to understand valuation, so let us introduce you to Narratives. Here, you write a clear story about Illumina, link that story to your own revenue, earnings and margin assumptions, and the Simply Wall St platform in the Community page turns it into a fair value that you can compare with the current price to help you decide if the stock looks attractive or expensive. You can keep that view updated automatically as fresh news or earnings arrive, and even see how other investors can look at the same facts and reach very different conclusions. For example, one Illumina Narrative might lean on the higher analyst targets around US$185 with confidence in China execution and multiomics, while another might anchor closer to US$75 with more weight on regulatory and competition risks.
Do you think there’s more to the story for Illumina? Head over to our Community to see what others are saying!
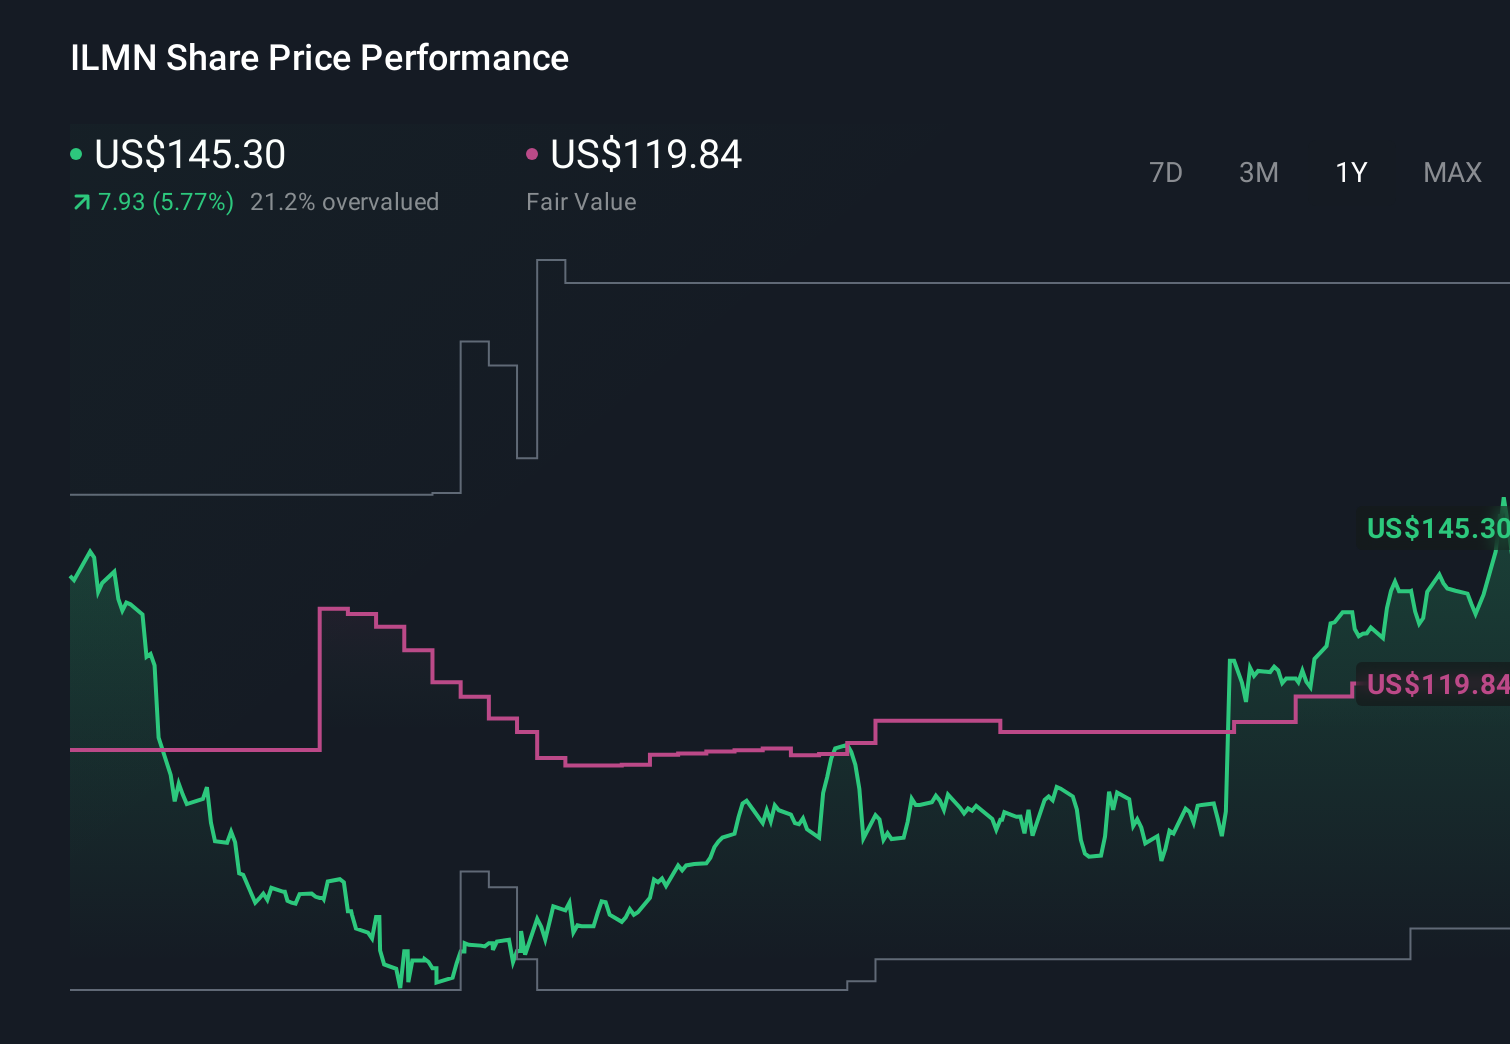 NasdaqGS:ILMN 1-Year Stock Price Chart
This article by Simply Wall St is general in nature. We provide commentary based on historical data
and analyst forecasts only using an unbiased methodology and our articles are not intended to be financial advice. It does not constitute a recommendation to buy or sell any stock, and does not take account of your objectives, or your
financial situation. We aim to bring you long-term focused analysis driven by fundamental data.
Note that our analysis may not factor in the latest price-sensitive company announcements or qualitative material.
Simply Wall St has no position in any stocks mentioned.
Our new AI Stock Screener scans the market every day to uncover opportunities.
• Dividend Powerhouses (3%+ Yield)
• Undervalued Small Caps with Insider Buying
• High growth Tech and AI Companies
Or build your own from over 50 metrics.
Have feedback on this article? Concerned about the content? Get in touch with us directly. Alternatively, email editorial-team@simplywallst.com