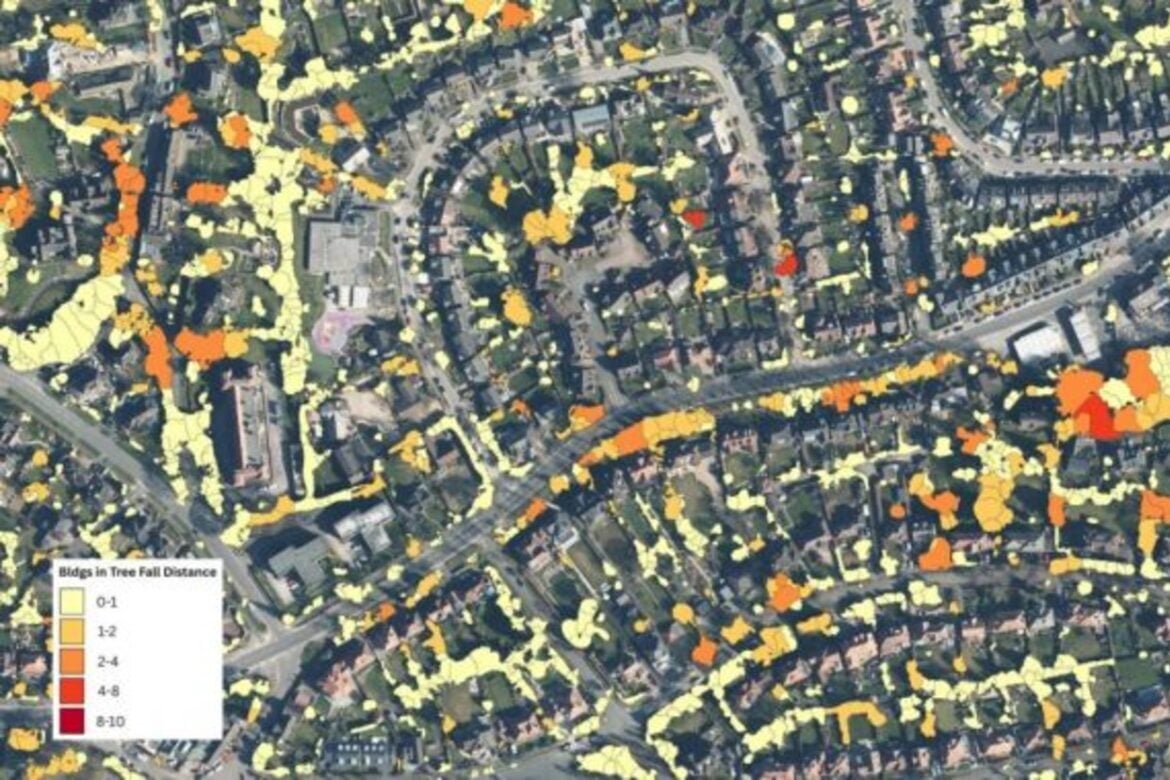
Bluesky International, a UK‑based geospatial data company, has created a visualization showing how many buildings across the UK fall within the potential fall distance of nearby trees. Using aerial survey–derived tree height and location data combined with building footprint data, the map uses color shading to indicate the number of structures that could be affected if a tree were to fall, with lighter colors indicating fewer buildings and darker colors indicating higher exposure. This makes it possible to quickly identify clusters of higher exposure, such as dense residential streets and supports more targeted maintenance and inspections.