
Phillips 66 scores just 2/6 on our valuation checks. See what other red flags we found in the full valuation breakdown.
Approach 1: Phillips 66 Discounted Cash Flow (DCF) Analysis
A Discounted Cash Flow, or DCF, model projects a company’s future cash flows and then discounts them back to today using a required return, to estimate what the business might be worth in total right now.
For Phillips 66, the model used is a 2 Stage Free Cash Flow to Equity approach based on cash flow projections. The latest twelve month free cash flow is about $1.48b. Ten year projections provided in the model indicate free cash flow of around $6.68b by 2035, with interim estimates such as $3.86b in 2026 and $5.38b in 2030, all expressed in dollars and discounted back to today.
Aggregating and discounting these projected cash flows results in an estimated intrinsic value of about $327.20 per share for Phillips 66. Compared with a current share price of roughly $138.28, the DCF output suggests the stock is trading at a 57.7% discount, which indicates implied undervaluation on this model.
Result: UNDERVALUED
Our Discounted Cash Flow (DCF) analysis suggests Phillips 66 is undervalued by 57.7%. Track this in your watchlist or portfolio, or discover 873 more undervalued stocks based on cash flows.
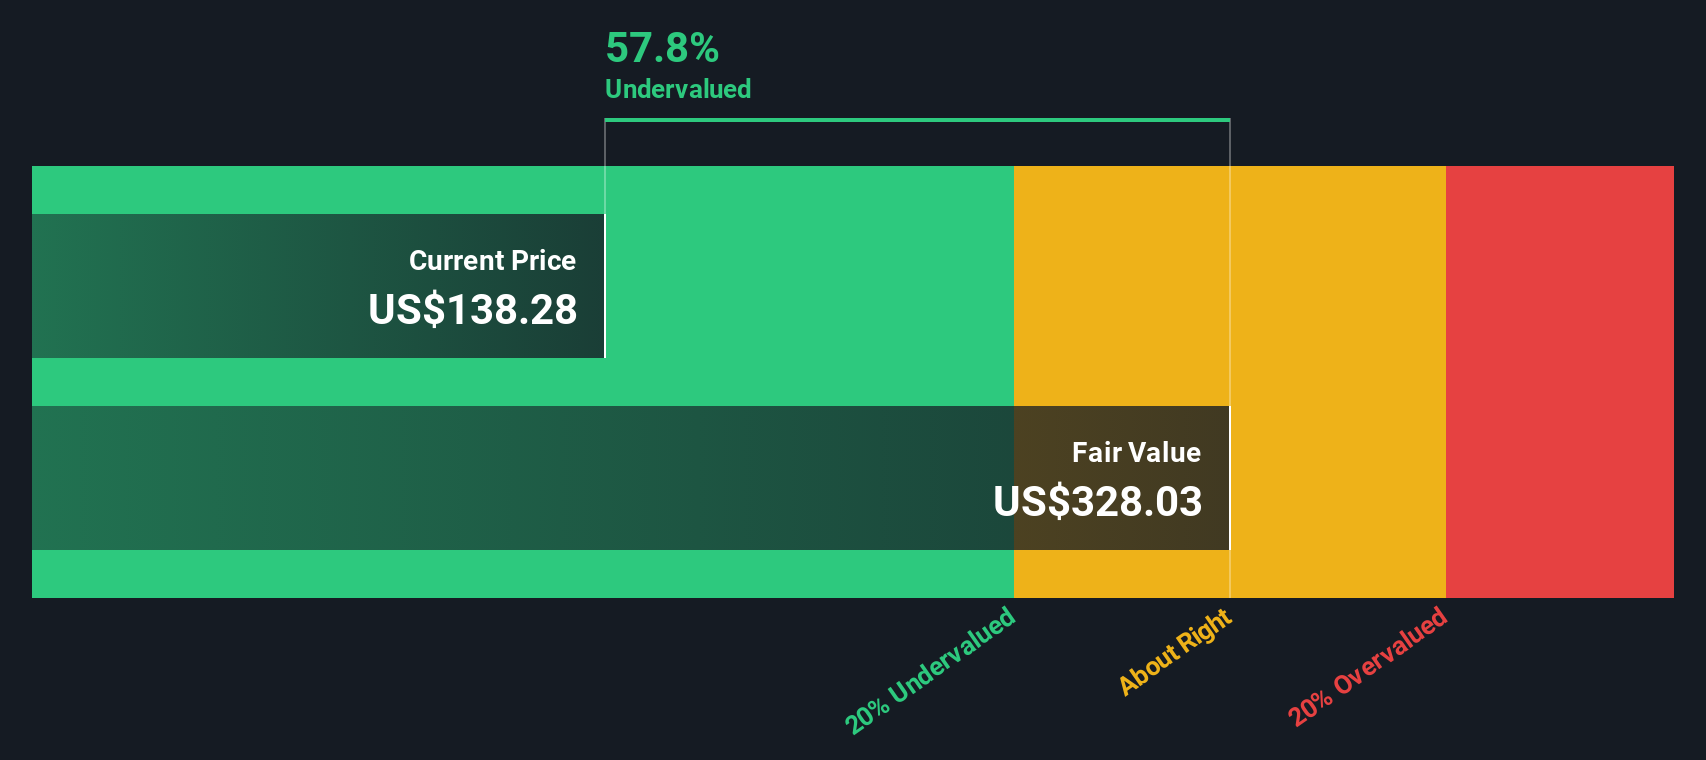 PSX Discounted Cash Flow as at Jan 2026
Approach 2: Phillips 66 Price vs Earnings
For profitable companies, the P/E ratio is a straightforward way to think about value because it links what you pay for each share to the earnings that each share produces. Investors usually accept a higher P/E when they expect stronger earnings growth or see the business as lower risk, and a lower P/E when growth expectations or perceived risk are more subdued.
Phillips 66 is currently trading on a P/E of about 37.2x. That sits above the Oil and Gas industry average P/E of roughly 13.7x, and also above a peer group average of around 26.4x. On the surface, that gap suggests investors are paying a higher price for each dollar of earnings compared with many industry peers.
Simply Wall St’s Fair Ratio for Phillips 66 is around 23.9x. This Fair Ratio is a proprietary estimate of what the P/E could look like given factors such as the company’s earnings profile, its industry, profit margins, market cap and key risks. Because it tries to account for these company specific drivers, it can be more tailored than simply lining the stock up next to crude industry or peer averages. Comparing the Fair Ratio of 23.9x with the current P/E of 37.2x points to Phillips 66 trading on a richer multiple than this framework suggests.
Result: OVERVALUED
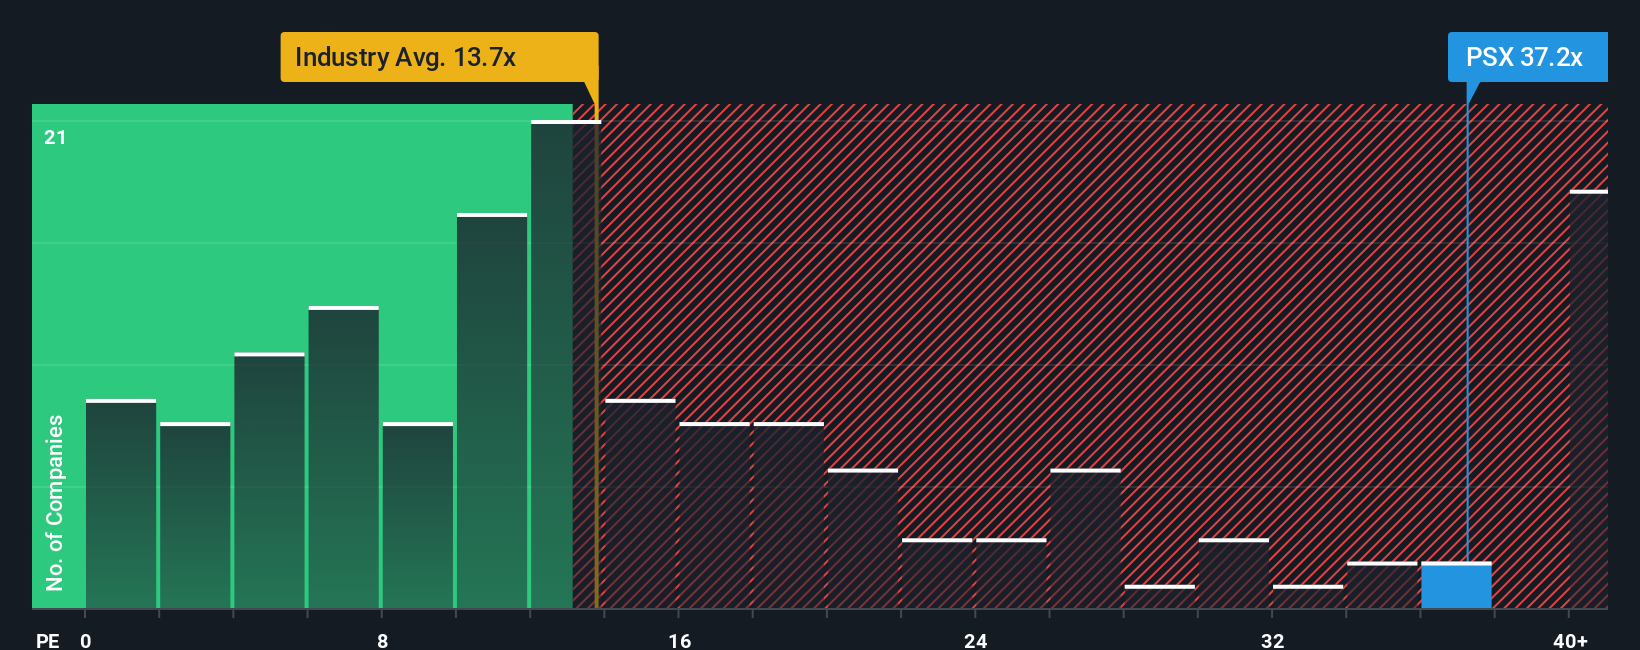 NYSE:PSX P/E Ratio as at Jan 2026
P/E ratios tell one story, but what if the real opportunity lies elsewhere? Discover 1442 companies where insiders are betting big on explosive growth.
Upgrade Your Decision Making: Choose your Phillips 66 Narrative
Earlier we mentioned that there is an even better way to understand valuation, so let us introduce Narratives, which are simply your story about a company tied directly to your own forecast for its revenue, earnings, margins and fair value, then compared with the current share price to help you make decisions.
On Simply Wall St’s Community page, Narratives are an easy tool you can use to connect what you believe about Phillips 66 with numbers. This way, your view of the business turns into a concrete fair value that automatically refreshes when new earnings, news or forecasts are added to the platform.
For example, one Phillips 66 Narrative currently points to a fair value around US$268.71 per share using assumptions like 3.0% revenue growth, a 4.0% profit margin, a 20.0x future P/E and a 6.0% discount rate. Another Narrative points to a fair value closer to US$149.30 based on revenue declining 1.36% a year, a 4.28% margin, a 13.07x future P/E and a 6.96% discount rate. This shows how two investors using the same company can reach very different yet structured conclusions about whether today’s price near US$138.28 looks above or below what they see as fair.
Do you think there’s more to the story for Phillips 66? Head over to our Community to see what others are saying!
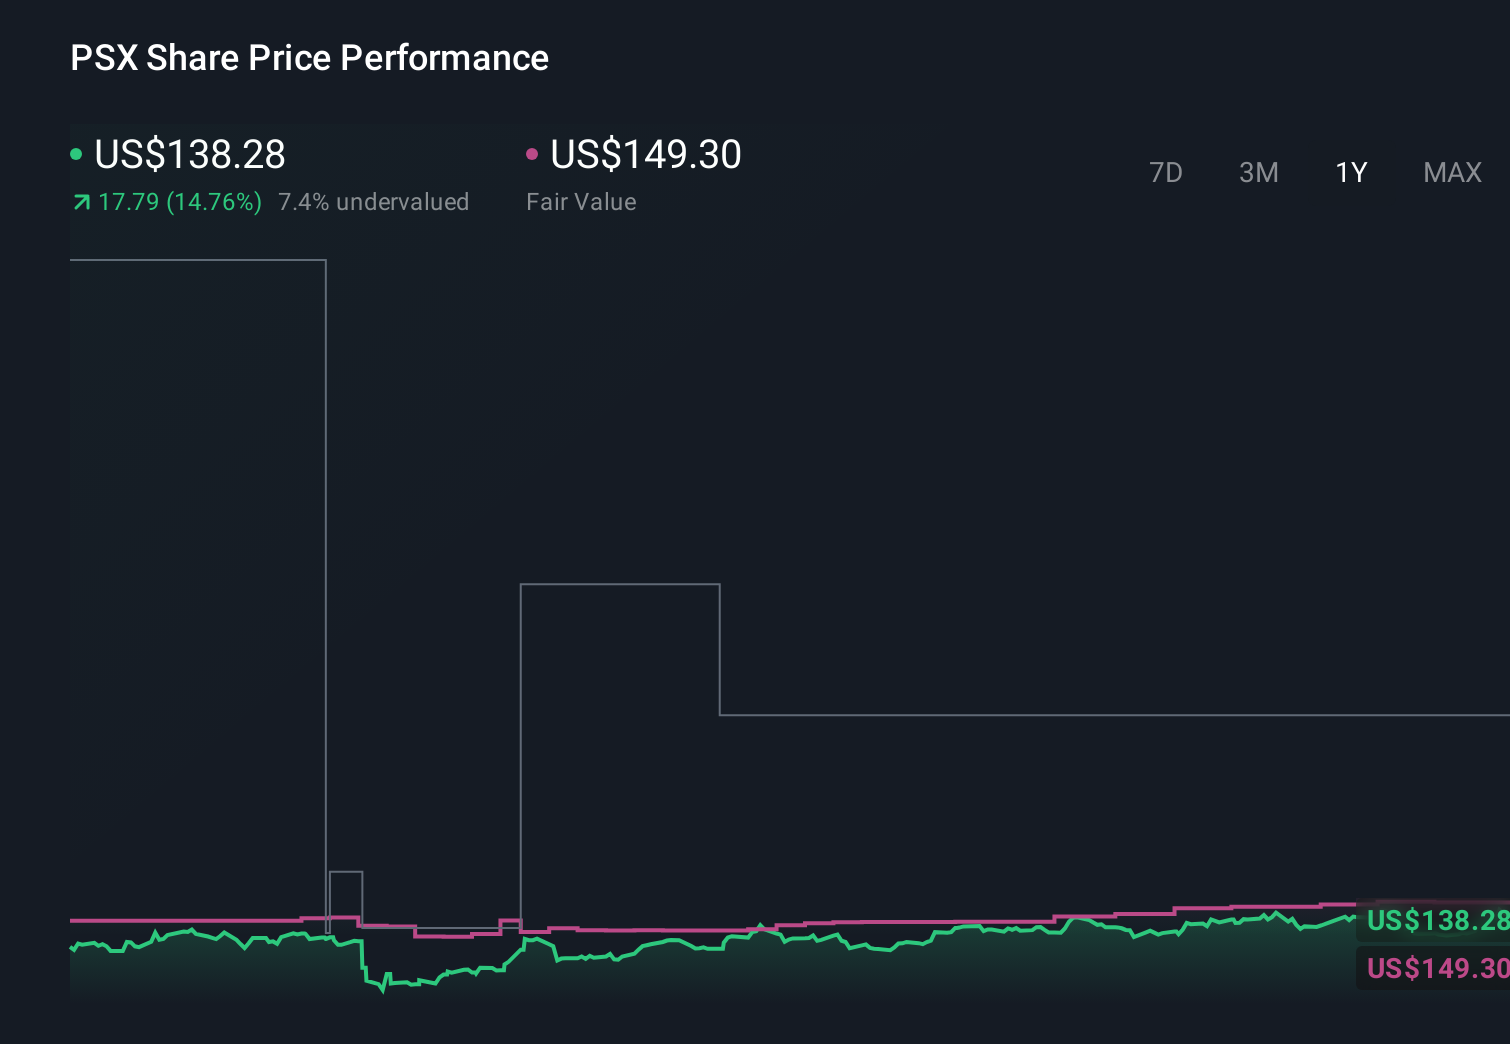 NYSE:PSX 1-Year Stock Price Chart
This article by Simply Wall St is general in nature. We provide commentary based on historical data
and analyst forecasts only using an unbiased methodology and our articles are not intended to be financial advice. It does not constitute a recommendation to buy or sell any stock, and does not take account of your objectives, or your
financial situation. We aim to bring you long-term focused analysis driven by fundamental data.
Note that our analysis may not factor in the latest price-sensitive company announcements or qualitative material.
Simply Wall St has no position in any stocks mentioned.
We’ve created the ultimate portfolio companion for stock investors, and it’s free.
• Connect an unlimited number of Portfolios and see your total in one currency
• Be alerted to new Warning Signs or Risks via email or mobile
• Track the Fair Value of your stocks
Have feedback on this article? Concerned about the content? Get in touch with us directly. Alternatively, email editorial-team@simplywallst.com