
Mercury General (MCY) recently announced a dual listing on NYSE Texas, keeping its primary NYSE listing while using the same MCY ticker. The move is tied directly to its growing footprint in Texas insurance markets.
See our latest analysis for Mercury General.
Mercury General’s dual listing comes after a period of mixed short term share price moves but very strong longer term gains, with a 14.56% 90 day share price return and a 92.52% 1 year total shareholder return that suggest momentum has been building.
If this kind of insurance focused story has your attention, it can be a good time to scan other solid balance sheet and fundamentals stocks screener (None results) as potential ideas alongside Mercury General.
After a 1 year total return of 92.52% and a recent price of US$91.09, Mercury General is no longer flying under the radar. However, with a US$100 analyst target and changing fundamentals, investors may be wondering whether there is still an entry point here or if the market is already baking in future growth.
Most Popular Narrative: 8.9% Undervalued
With Mercury General’s fair value estimate of US$100 sitting above the last close at US$91.09, the most followed narrative sees some upside still on the table.
The company’s core underlying business, excluding catastrophe losses, is strong with favorable underlying combined ratios in their personal auto and homeowners business. This suggests potential for improvement in future earnings stability and net margins.
Want to see what is backing that fair value? The narrative focuses on steady premium levels, firm margins and a valuation multiple that is below the broader insurance peer group. Curious which specific earnings and revenue paths have been penciled in to reach that outcome?
Result: Fair Value of $100 (UNDERVALUED)
Have a read of the narrative in full and understand what’s behind the forecasts.
However, that upside story could be challenged if wildfire related catastrophe losses and any higher reinsurance costs weigh more heavily on margins and cash flow than expected.
Find out about the key risks to this Mercury General narrative.
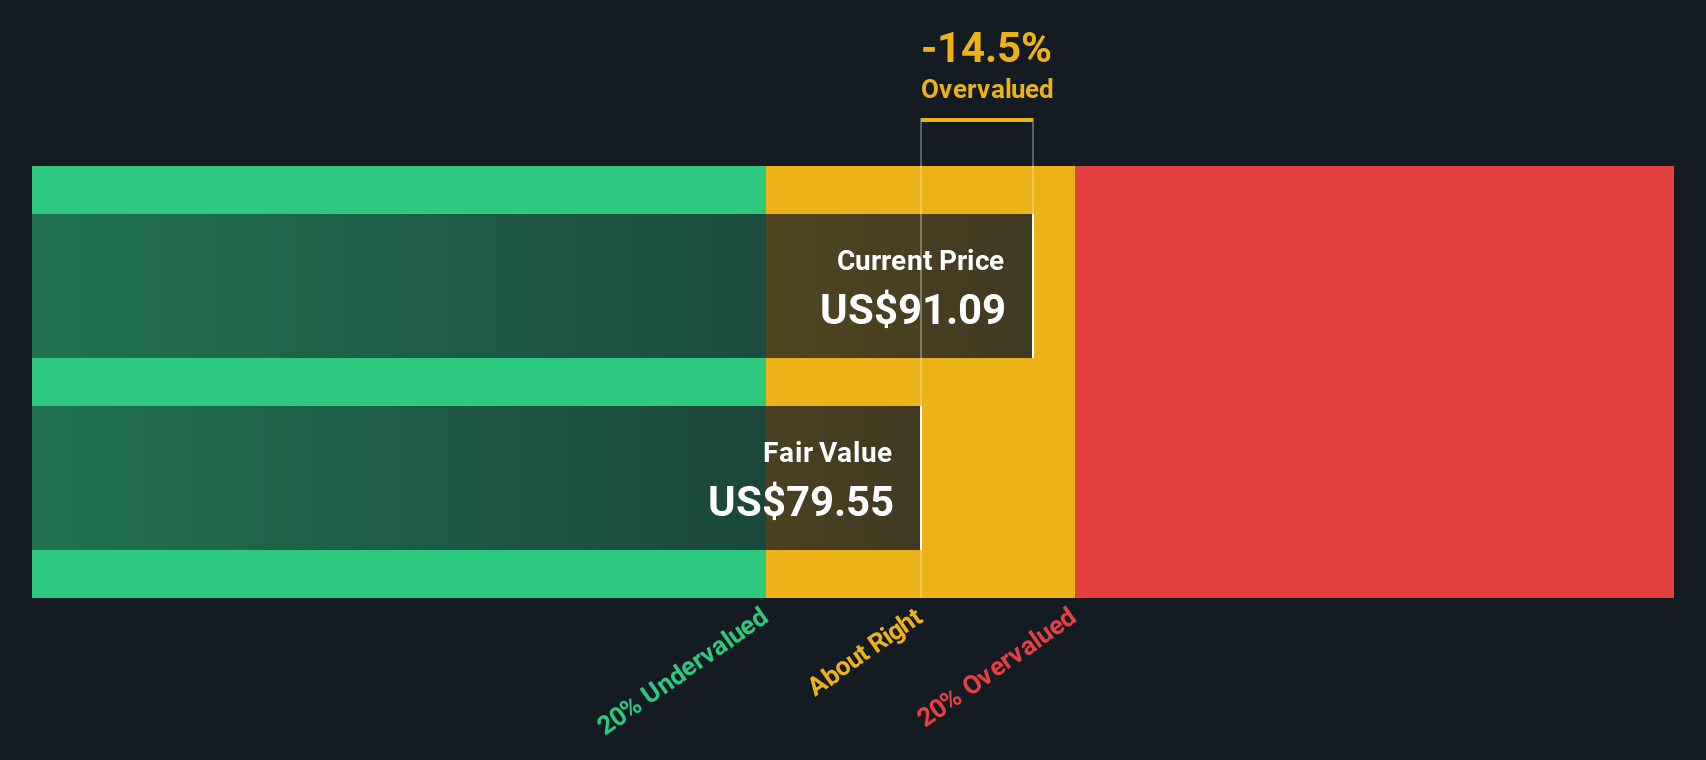
Another View: Our DCF Says The Market May Be Ahead Of Itself
The popular narrative sees Mercury General as 8.9% undervalued at US$91.09 versus a US$100 fair value, but our DCF model points in the other direction. On that approach, MCY is trading above an estimated fair value of US$79.55, which suggests limited margin of safety today.
That split between an upside story and a DCF that looks a bit tight raises a practical question for you as an investor: do you lean more on earnings multiples or on cash flow driven estimates when they disagree like this?
Look into how the SWS DCF model arrives at its fair value.
 MCY Discounted Cash Flow as at Jan 2026
Simply Wall St performs a discounted cash flow (DCF) on every stock in the world every day (check out Mercury General for example). We show the entire calculation in full. You can track the result in your watchlist or portfolio and be alerted when this changes, or use our stock screener to discover 873 undervalued stocks based on their cash flows. If you save a screener we even alert you when new companies match – so you never miss a potential opportunity.
Build Your Own Mercury General Narrative
If you look at this and feel differently, or simply prefer to work from your own numbers, you can build a custom view of Mercury General in just a few minutes, Do it your way.
A great starting point for your Mercury General research is our analysis highlighting 2 key rewards and 2 important warning signs that could impact your investment decision.
Ready to find your next idea?
If Mercury General has sparked your curiosity, do not stop here. Broaden your watchlist with focused stock lists that surface different types of opportunities.
This article by Simply Wall St is general in nature. We provide commentary based on historical data
and analyst forecasts only using an unbiased methodology and our articles are not intended to be financial advice. It does not constitute a recommendation to buy or sell any stock, and does not take account of your objectives, or your
financial situation. We aim to bring you long-term focused analysis driven by fundamental data.
Note that our analysis may not factor in the latest price-sensitive company announcements or qualitative material.
Simply Wall St has no position in any stocks mentioned.
We’ve created the ultimate portfolio companion for stock investors, and it’s free.
• Connect an unlimited number of Portfolios and see your total in one currency
• Be alerted to new Warning Signs or Risks via email or mobile
• Track the Fair Value of your stocks
Have feedback on this article? Concerned about the content? Get in touch with us directly. Alternatively, email editorial-team@simplywallst.com