
With no single headline event driving Ivanhoe Mines (TSX:IVN) today, investors are instead weighing its recent share performance, current valuation signals, and the scale of its Africa focused copper and precious metals portfolio.
See our latest analysis for Ivanhoe Mines.
The share price has eased in the very short term, with a 1 day share price return of 1.28% decline and a 7 day share price return of 1.40% decline. However, the 90 day share price return of 9.17% and 5 year total shareholder return of 156.98% point to longer term momentum that investors are weighing against current valuation signals and project execution risks.
If Ivanhoe’s mix of copper and precious metals has your attention, this could be a good moment to broaden your search and check out fast growing stocks with high insider ownership.
So with Ivanhoe Mines trading at CA$16.19, sitting on mixed short term returns but a long term track record and analyst targets implying some upside, is this a genuine opportunity or is the market already pricing in future growth?
Price-to-earnings of 54.6x: Is it justified?
Ivanhoe Mines is trading on a P/E of 54.6x, which suggests the market is placing a high value on each dollar of current earnings at the CA$16.19 share price.
The P/E ratio compares the share price to earnings per share and is a common way investors look at how much they are paying for a company’s profits. For a miner like Ivanhoe, a higher P/E often reflects expectations that current projects and future output could influence earnings over time.
However, Ivanhoe’s current P/E of 54.6x is more than double the Canadian Metals and Mining industry average of 26x and also sits above the estimated fair P/E of 28x from the SWS fair ratio work. That gap suggests the market price is richer than both its sector and the level our fair ratio points to as a potential anchor.
Explore the SWS fair ratio for Ivanhoe Mines
Result: Price-to-earnings of 54.6x (OVERVALUED)
However, investors still need to watch for execution risks across multiple African projects and the possibility that weaker commodity prices could challenge a 54.6x P/E.
Find out about the key risks to this Ivanhoe Mines narrative.
Another view from our DCF model
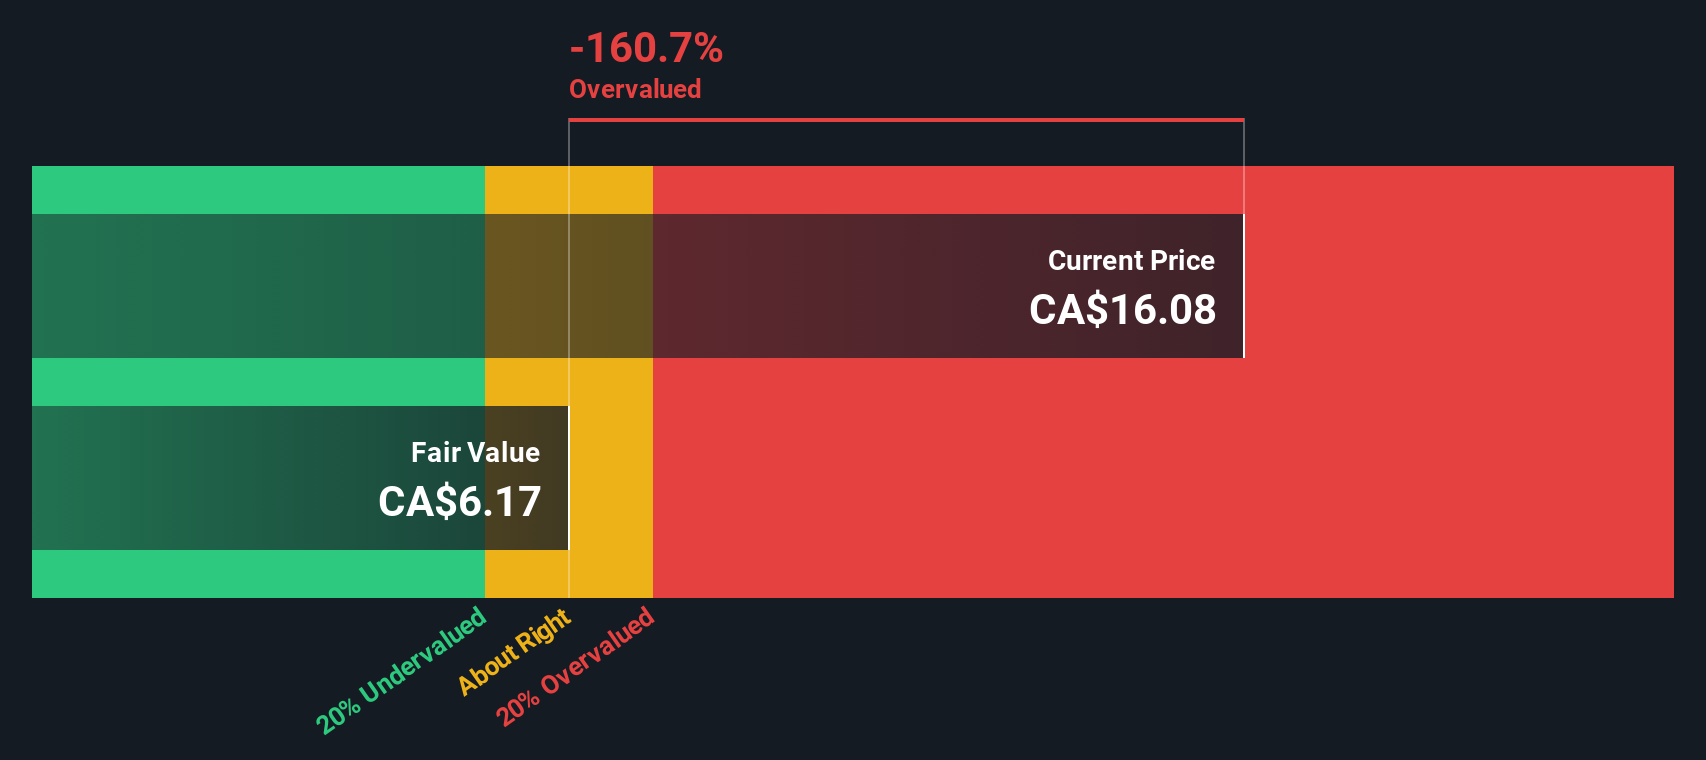
Our DCF model suggests a future cash flow value of CA$6.15 per share, compared with the current CA$16.19 price. That indicates Ivanhoe may be trading well above this cash flow based estimate. This raises a straightforward question for you: is the market paying up for growth too early?
Look into how the SWS DCF model arrives at its fair value.
 IVN Discounted Cash Flow as at Jan 2026
Simply Wall St performs a discounted cash flow (DCF) on every stock in the world every day (check out Ivanhoe Mines for example). We show the entire calculation in full. You can track the result in your watchlist or portfolio and be alerted when this changes, or use our stock screener to discover 880 undervalued stocks based on their cash flows. If you save a screener we even alert you when new companies match – so you never miss a potential opportunity.
Build Your Own Ivanhoe Mines Narrative
If this framework does not quite fit how you see Ivanhoe, or you prefer to rely on your own research, you can shape a personalised view in just a few minutes with Do it your way.
A great starting point for your Ivanhoe Mines research is our analysis highlighting 2 key rewards and 1 important warning sign that could impact your investment decision.
Ready for more investment ideas?
If Ivanhoe Mines is on your radar, do not stop there. Use the Simply Wall St Screener to quickly surface other focused ideas that fit your style.
This article by Simply Wall St is general in nature. We provide commentary based on historical data
and analyst forecasts only using an unbiased methodology and our articles are not intended to be financial advice. It does not constitute a recommendation to buy or sell any stock, and does not take account of your objectives, or your
financial situation. We aim to bring you long-term focused analysis driven by fundamental data.
Note that our analysis may not factor in the latest price-sensitive company announcements or qualitative material.
Simply Wall St has no position in any stocks mentioned.
Our new AI Stock Screener scans the market every day to uncover opportunities.
• Dividend Powerhouses (3%+ Yield)
• Undervalued Small Caps with Insider Buying
• High growth Tech and AI Companies
Or build your own from over 50 metrics.
Have feedback on this article? Concerned about the content? Get in touch with us directly. Alternatively, email editorial-team@simplywallst.com