
TE Connectivity scores just 2/6 on our valuation checks. See what other red flags we found in the full valuation breakdown.
Approach 1: TE Connectivity Discounted Cash Flow (DCF) Analysis
A Discounted Cash Flow, or DCF, model estimates what a company might be worth by projecting its future cash flows and then discounting those back to today’s value. It is essentially asking what all those future dollars are worth in today’s terms.
For TE Connectivity, the model used is a 2 Stage Free Cash Flow to Equity approach. The latest twelve month free cash flow stands at about US$3.25b. Analysts provide specific free cash flow estimates out to 2030, with TE Connectivity’s projected free cash flow in that year at US$3.73b. Beyond the explicit analyst period, Simply Wall St extrapolates the remaining years to build a ten year cash flow path. This is then discounted back to the present.
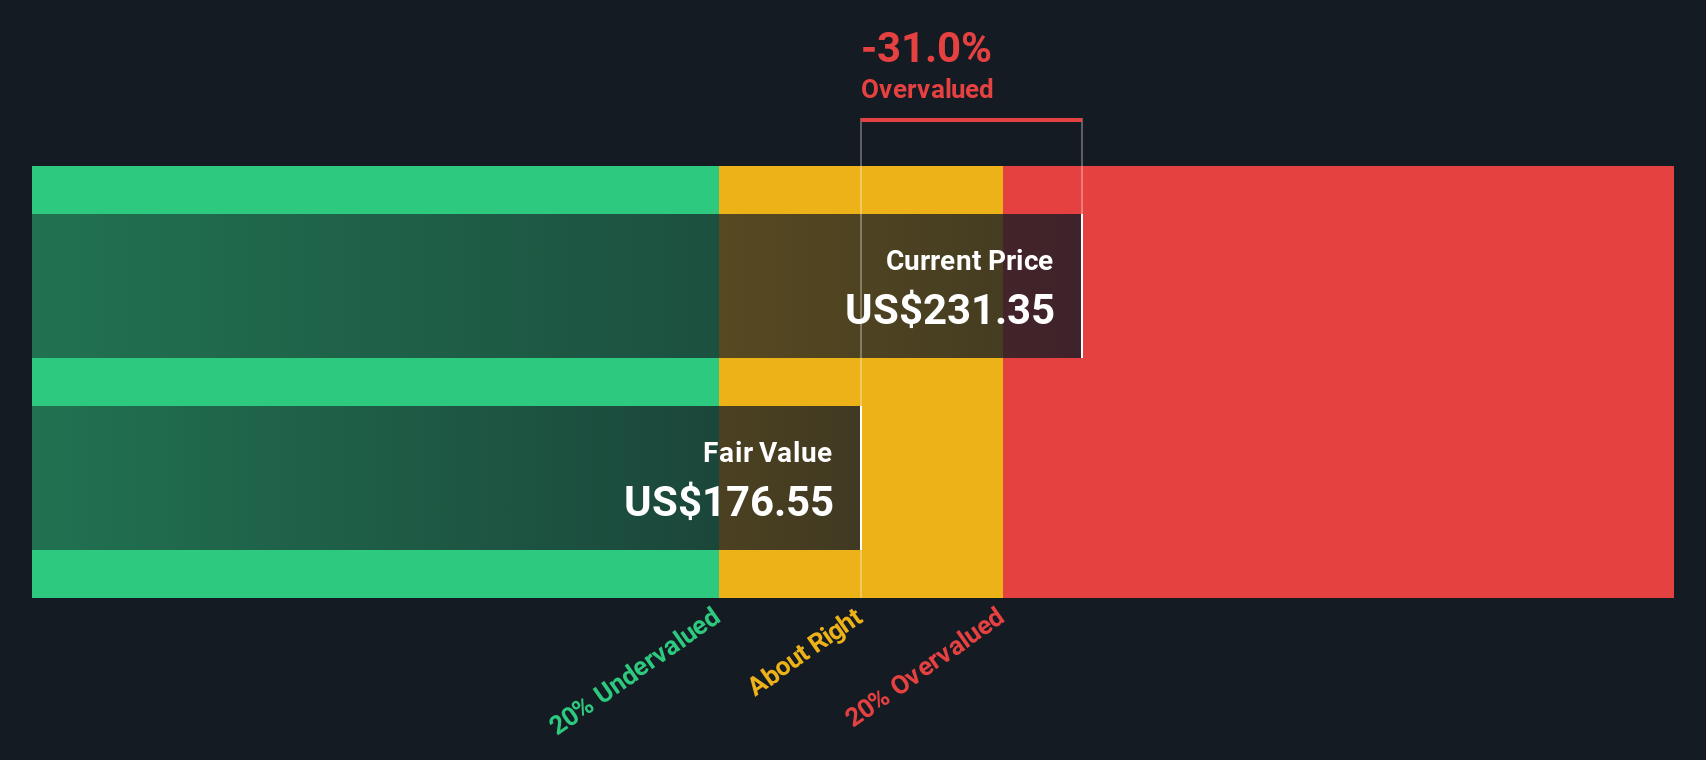
Bringing all those discounted cash flows together gives an estimated intrinsic value of US$176.80 per share. Compared with the recent share price of US$223.84, the DCF output suggests the stock screens as 26.6% overvalued on this set of assumptions.
Result: OVERVALUED
Our Discounted Cash Flow (DCF) analysis suggests TE Connectivity may be overvalued by 26.6%. Discover 864 undervalued stocks or create your own screener to find better value opportunities.
 TEL Discounted Cash Flow as at Jan 2026
Approach 2: TE Connectivity Price vs Earnings
For a profitable company like TE Connectivity, the P/E ratio is a useful shorthand for how much investors are paying for each dollar of earnings. It ties directly to what the business is currently earning, which many investors find easier to relate to than cash flow models.
What counts as a “normal” P/E usually reflects how the market views a company’s growth potential and risk. Higher expected growth or lower perceived risk can justify a higher P/E, while slower growth or higher risk can point to a lower one as being more reasonable.
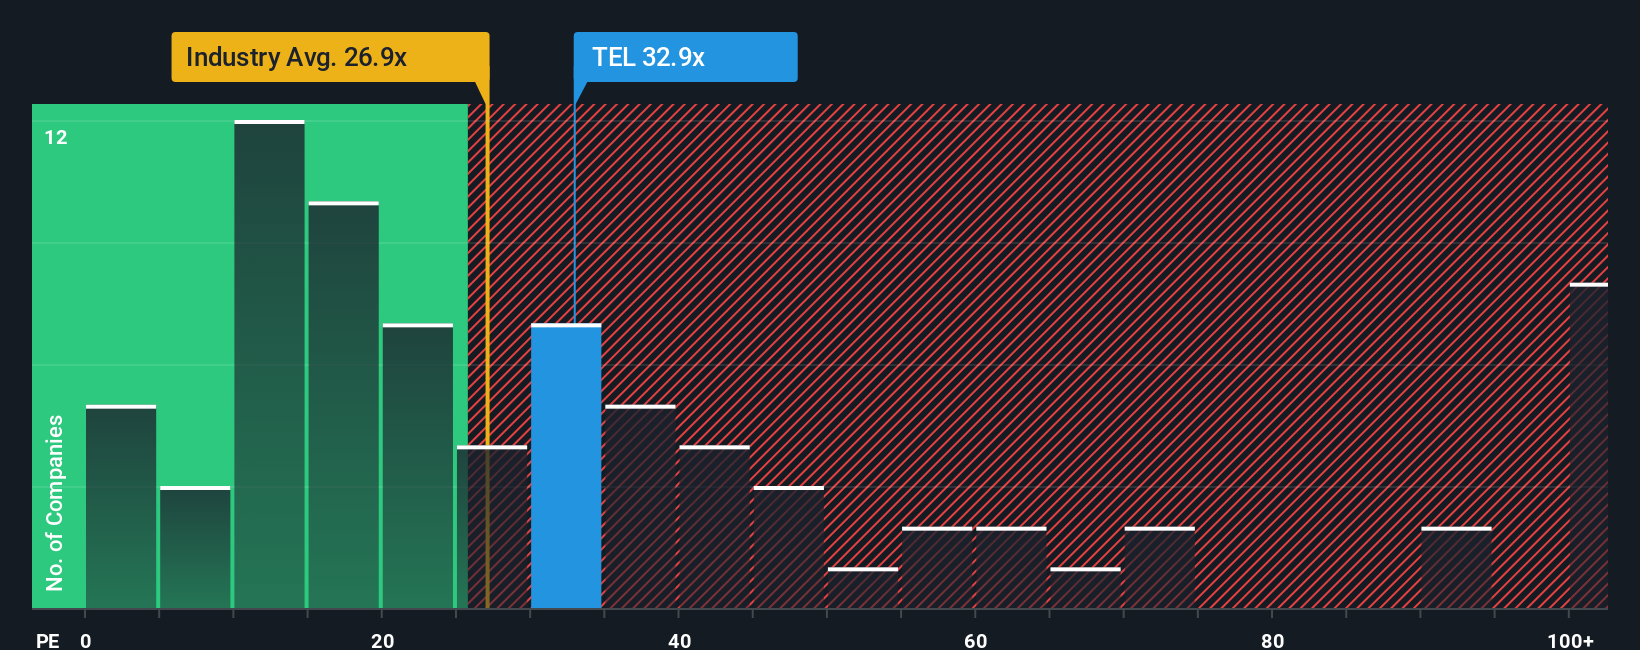
TE Connectivity currently trades on a P/E of 31.80x. That sits above the Electronic industry average of 26.93x, while the average for peers in its group is 46.38x. Simply Wall St’s Fair Ratio for TE Connectivity is 29.44x. This Fair Ratio is a proprietary estimate of what the P/E could be given factors such as the company’s earnings growth profile, profitability, industry, market cap and specific risks.
Compared with simple industry or peer comparisons, the Fair Ratio aims to tailor the P/E to TE Connectivity’s own characteristics, rather than assuming it should trade exactly in line with the broader group.
Set against the Fair Ratio of 29.44x, the current P/E of 31.80x suggests the shares screen as overvalued on this metric.
Result: OVERVALUED
 NYSE:TEL P/E Ratio as at Jan 2026
P/E ratios tell one story, but what if the real opportunity lies elsewhere? Discover 1428 companies where insiders are betting big on explosive growth.
Upgrade Your Decision Making: Choose your TE Connectivity Narrative
Earlier we mentioned that there is an even better way to understand valuation, so let us introduce you to Narratives. Narratives let you attach a simple story, your view of a company, to the numbers like fair value, future revenue, earnings and margins.
A Narrative links what you believe about a company, for example TE Connectivity’s role in electronic components and connectivity solutions, to a forecast, then to a fair value that you can compare with today’s share price.
On Simply Wall St, within the Community page used by millions of investors, Narratives are designed to be straightforward. They help you decide whether the gap between your Fair Value and the current Price suggests a possible buying opportunity or a reason to wait.
Narratives are also kept fresh. When new information such as news or earnings is released, the underlying assumptions and fair values are updated so your TE Connectivity view can adjust in real time.
For example, one TE Connectivity Narrative might see a higher fair value based on confident assumptions about future revenue and margins, while another Narrative might use more cautious assumptions and arrive at a lower fair value. This shows how the same company can look different depending on your story and numbers.
Do you think there’s more to the story for TE Connectivity? Head over to our Community to see what others are saying!
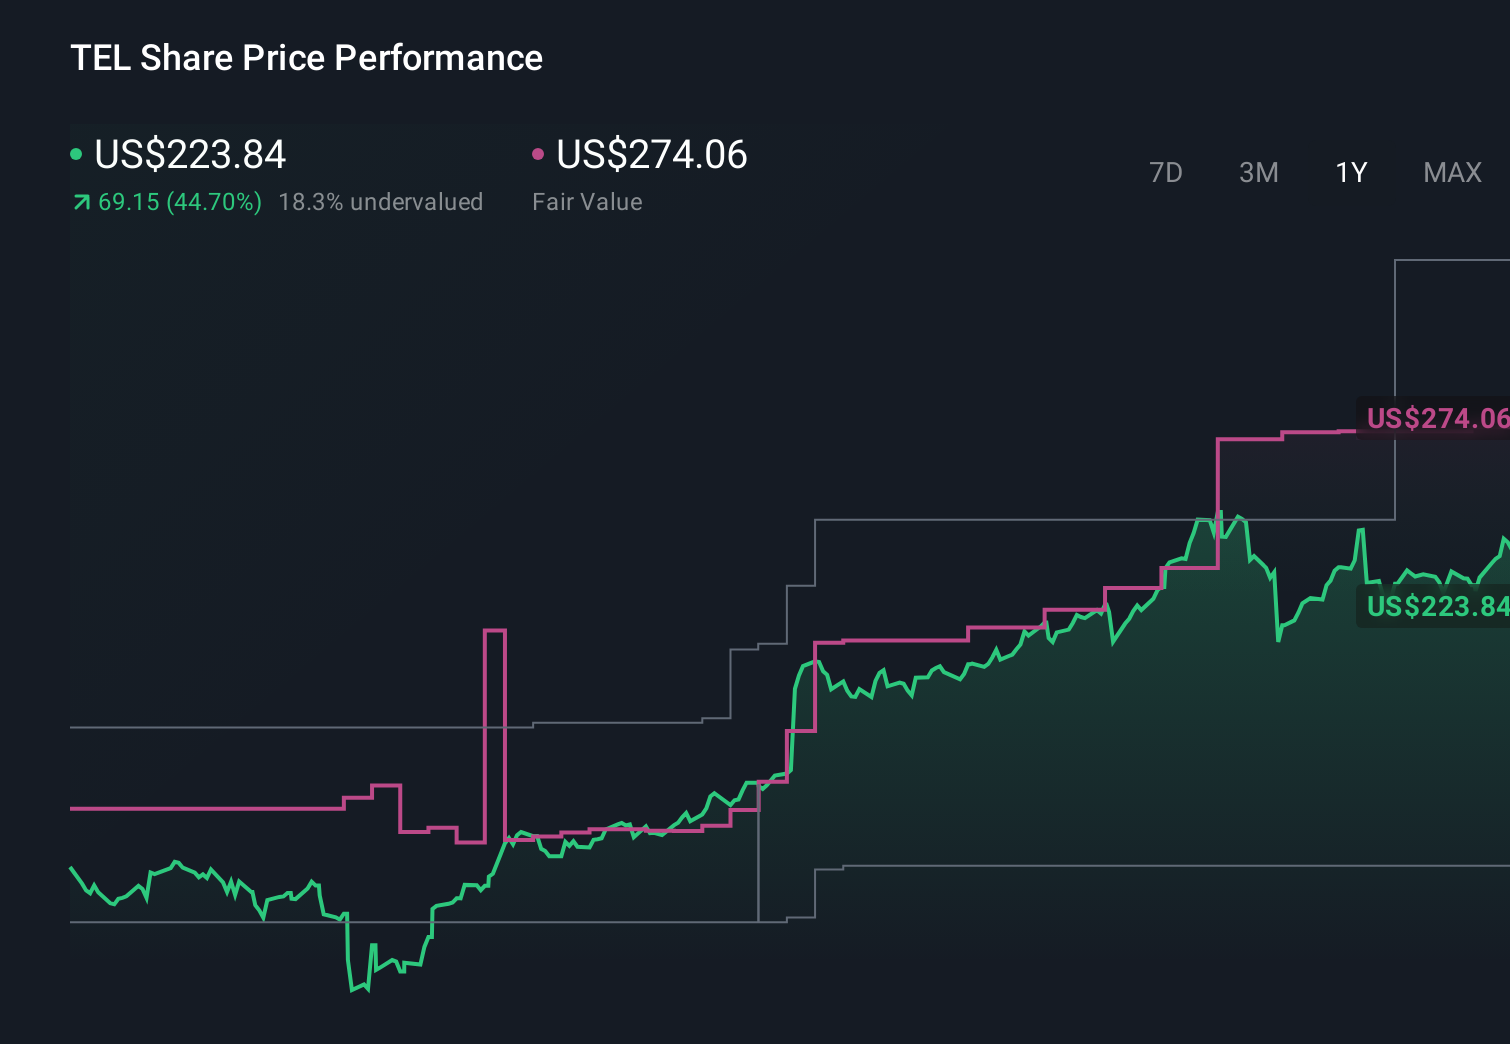 NYSE:TEL 1-Year Stock Price Chart
This article by Simply Wall St is general in nature. We provide commentary based on historical data
and analyst forecasts only using an unbiased methodology and our articles are not intended to be financial advice. It does not constitute a recommendation to buy or sell any stock, and does not take account of your objectives, or your
financial situation. We aim to bring you long-term focused analysis driven by fundamental data.
Note that our analysis may not factor in the latest price-sensitive company announcements or qualitative material.
Simply Wall St has no position in any stocks mentioned.
Discover if TE Connectivity might be undervalued or overvalued with our detailed analysis, featuring fair value estimates, potential risks, dividends, insider trades, and its financial condition.
Have feedback on this article? Concerned about the content? Get in touch with us directly. Alternatively, email editorial-team@simplywallst.com