
GameStop scores just 2/6 on our valuation checks. See what other red flags we found in the full valuation breakdown.
Approach 1: GameStop Discounted Cash Flow (DCF) Analysis
A Discounted Cash Flow, or DCF, model takes estimates of a company’s future cash flows and discounts them back to today, aiming to translate those future dollars into a single present value per share.
For GameStop, the model used is a 2 Stage Free Cash Flow to Equity approach based on cash flow projections in $. The latest twelve month free cash flow is reported at about $563.2 million. Simply Wall St then extends analyst style forecasts out to 2035, with estimated free cash flows rising into the low billions of dollars by the end of that period. These future figures are discounted back using the model’s required return assumptions.
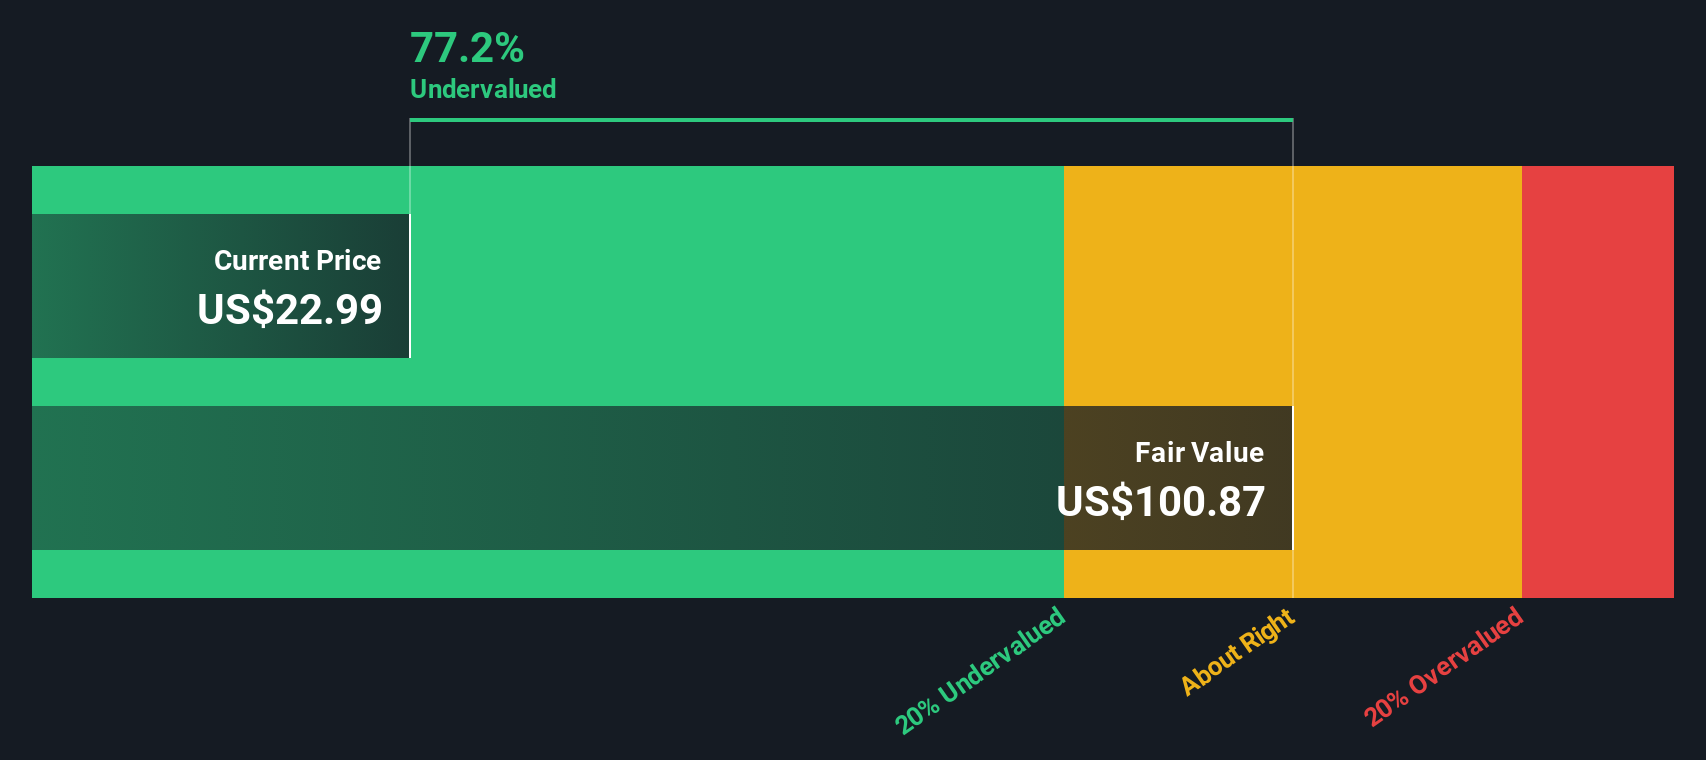
On this basis, the DCF estimate of intrinsic value for GameStop is $100.87 per share. Compared with the current market price, this implies an intrinsic discount of 77.2%, which indicates that the shares are trading well below this model’s estimate of value.
Result: UNDERVALUED
Our Discounted Cash Flow (DCF) analysis suggests GameStop is undervalued by 77.2%. Track this in your watchlist or portfolio, or discover 862 more undervalued stocks based on cash flows.
 GME Discounted Cash Flow as at Jan 2026
Approach 2: GameStop Price vs Earnings (P/E)
For profitable companies, the P/E ratio is a handy shorthand because it tells you how many dollars you are paying for each dollar of earnings. It ties directly to what the business is currently earning, which is often the first anchor investors look at when weighing a stock.
What counts as a “normal” P/E really depends on what investors think about a company’s growth potential and risk. Higher expected growth or lower perceived risk can support a higher P/E, while slower growth or higher risk tends to go with a lower P/E.
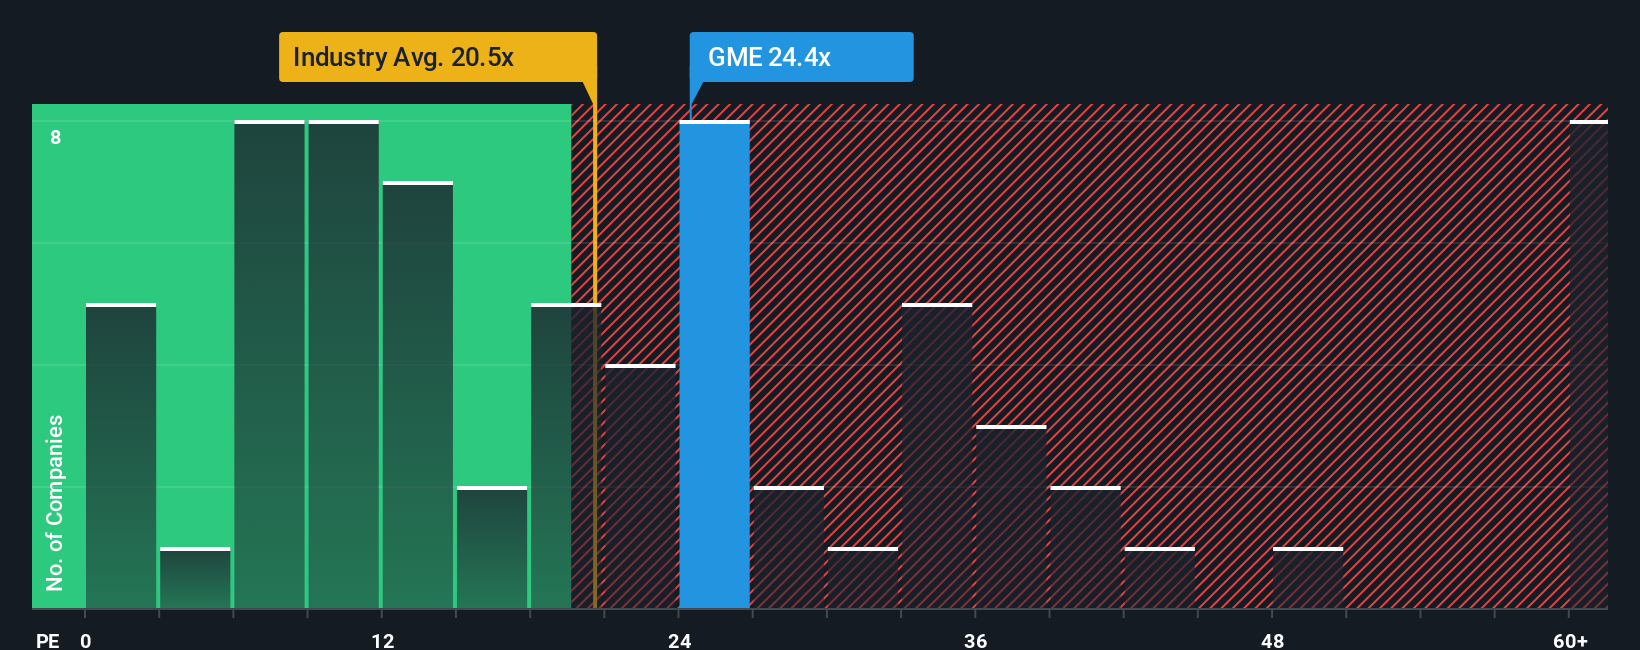
GameStop is trading on a P/E of 24.41x. That sits above both the Specialty Retail industry average P/E of 19.89x and the peer group average of 20.55x, so the market is currently assigning GameStop a richer earnings multiple than these benchmarks.
Simply Wall St also uses a proprietary “Fair Ratio”, which is the P/E it would expect for GameStop after considering factors like earnings growth, profit margins, size, industry and company specific risks. This tends to give a more tailored view than a simple comparison with peers or the industry, because it adjusts for the company’s own profile rather than assuming all retailers deserve the same multiple.
In this case, GameStop’s actual P/E of 24.41x is above its Fair Ratio, which points to the shares trading at a premium to that model’s estimate of a fair earnings multiple.
Result: OVERVALUED
 NYSE:GME P/E Ratio as at Jan 2026
P/E ratios tell one story, but what if the real opportunity lies elsewhere? Discover 1421 companies where insiders are betting big on explosive growth.
Upgrade Your Decision Making: Choose your GameStop Narrative
Earlier we mentioned that there is an even better way to understand valuation, so let us introduce you to Narratives. Narratives let you attach a clear story to your numbers by linking your view of GameStop’s future revenue, earnings and margins to a fair value estimate.
A Narrative on Simply Wall St is your own story about a company, written in numbers and words together. You can spell out why you think the business goes in a certain direction, how that flows into a forecast, and what you believe a fair value per share looks like.
These Narratives sit inside the Community page on the Simply Wall St platform, which is used by millions of investors. They help you decide what to do next by comparing your Fair Value to the live share price so you can see whether your story says the stock looks expensive, cheap, or close to fairly priced right now.
Narratives update automatically when new data comes in, such as earnings releases or major news. You can see very different GameStop views side by side. For example, one investor might publish a very optimistic Narrative with a high fair value, while another publishes a cautious Narrative with a much lower fair value.
Do you think there’s more to the story for GameStop? Head over to our Community to see what others are saying!
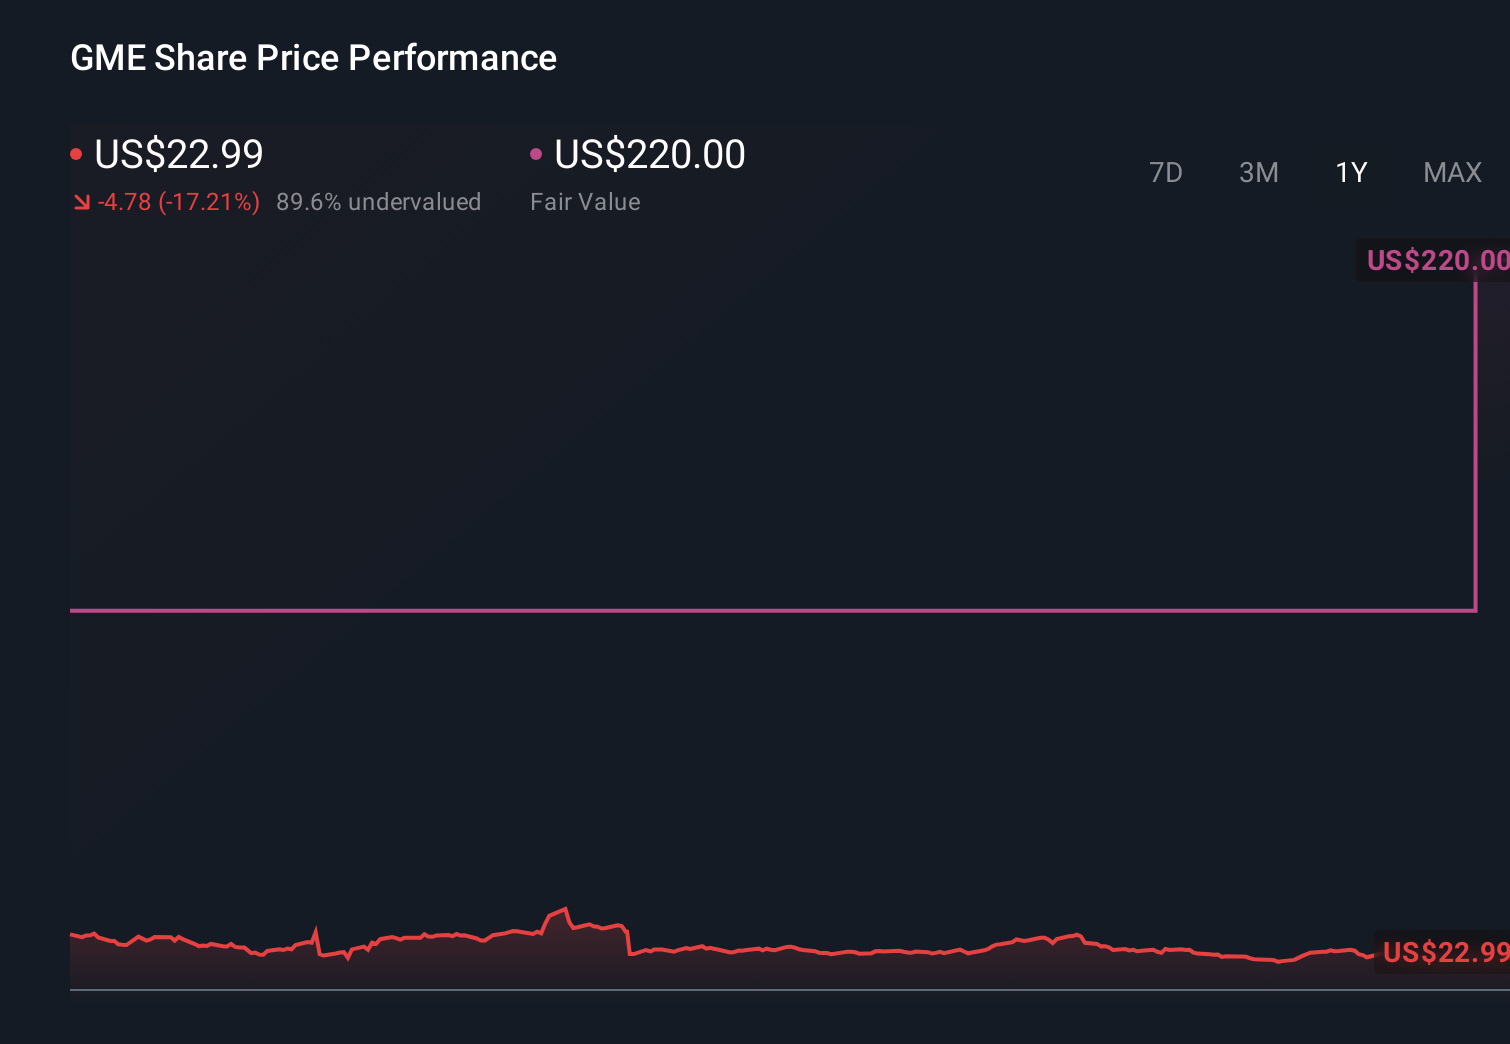 NYSE:GME 1-Year Stock Price Chart
This article by Simply Wall St is general in nature. We provide commentary based on historical data
and analyst forecasts only using an unbiased methodology and our articles are not intended to be financial advice. It does not constitute a recommendation to buy or sell any stock, and does not take account of your objectives, or your
financial situation. We aim to bring you long-term focused analysis driven by fundamental data.
Note that our analysis may not factor in the latest price-sensitive company announcements or qualitative material.
Simply Wall St has no position in any stocks mentioned.
We’ve created the ultimate portfolio companion for stock investors, and it’s free.
• Connect an unlimited number of Portfolios and see your total in one currency
• Be alerted to new Warning Signs or Risks via email or mobile
• Track the Fair Value of your stocks
Have feedback on this article? Concerned about the content? Get in touch with us directly. Alternatively, email editorial-team@simplywallst.com