Find out why Cheniere Energy’s -8.3% return over the last year is lagging behind its peers.
Approach 1: Cheniere Energy Discounted Cash Flow (DCF) Analysis
A Discounted Cash Flow, or DCF, model estimates what a company might be worth by projecting its future cash flows and then discounting those back to today’s value. It is essentially asking what all those future dollars are worth in your hand right now.
For Cheniere Energy, the model used is a 2 Stage Free Cash Flow to Equity approach. The latest twelve month free cash flow sits at about $2.81b. Analyst and extrapolated projections, provided by Simply Wall St, show annual free cash flow figures in the $3b to $5.7b range between 2026 and 2035, with an example projection of $4.68b in 2030.
Discounting those projected cash flows back to today produces an estimated intrinsic value of about $491.98 per share. Compared with the recent share price of $205.73, the model implies an intrinsic discount of 58.2%. On this DCF view, Cheniere Energy appears materially undervalued according to the model’s assumptions.
Result: UNDERVALUED
Our Discounted Cash Flow (DCF) analysis suggests Cheniere Energy is undervalued by 58.2%. Track this in your watchlist or portfolio, or discover 879 more undervalued stocks based on cash flows.
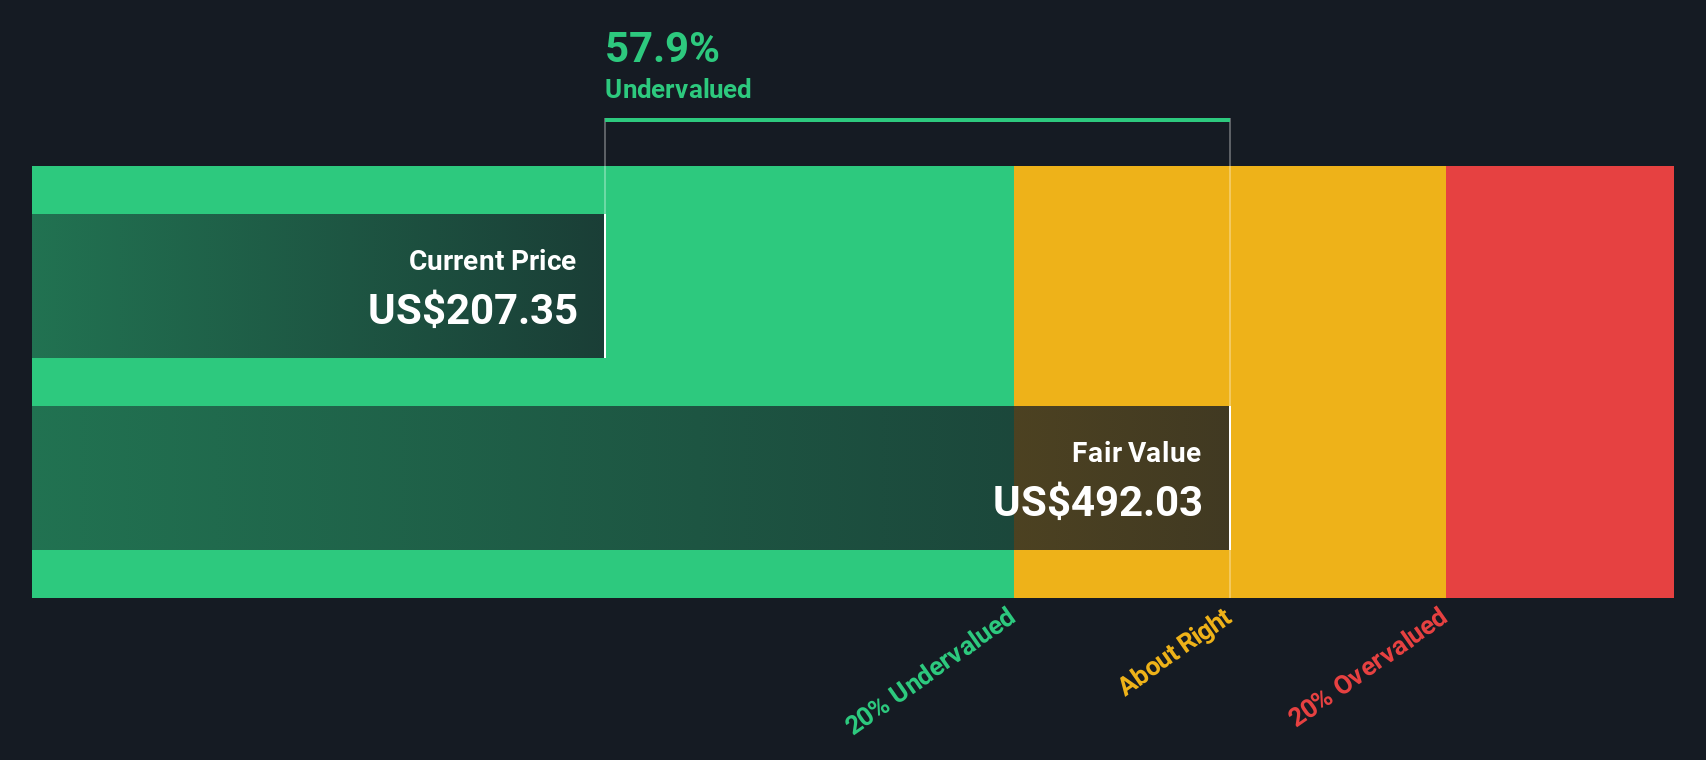 LNG Discounted Cash Flow as at Jan 2026
Approach 2: Cheniere Energy Price vs Earnings
For a profitable company, the P/E ratio is a useful shorthand for how much investors are paying for each dollar of earnings. It rolls together the market’s view on earnings quality into a single number that is easy to compare across companies.
What counts as a “fair” P/E usually reflects expectations for future earnings and the level of risk investors see. Higher growth or lower perceived risk often lines up with a higher P/E, while lower growth or higher perceived risk is usually associated with a lower P/E.
Cheniere Energy currently trades on a P/E of 11.08x. That sits below both the Oil and Gas industry average P/E of 13.60x and a peer group average of 16.68x. Simply Wall St’s Fair Ratio for Cheniere, which is 16.79x, goes a step further. It estimates the P/E you might expect for this specific company after factoring in earnings growth, profit margins, its industry, market cap and company specific risks.
Compared with simple peer or industry comparisons, the Fair Ratio aims to be more tailored to Cheniere’s own profile. With the current P/E of 11.08x sitting below the Fair Ratio of 16.79x, the shares appear inexpensive on this metric.
Result: UNDERVALUED
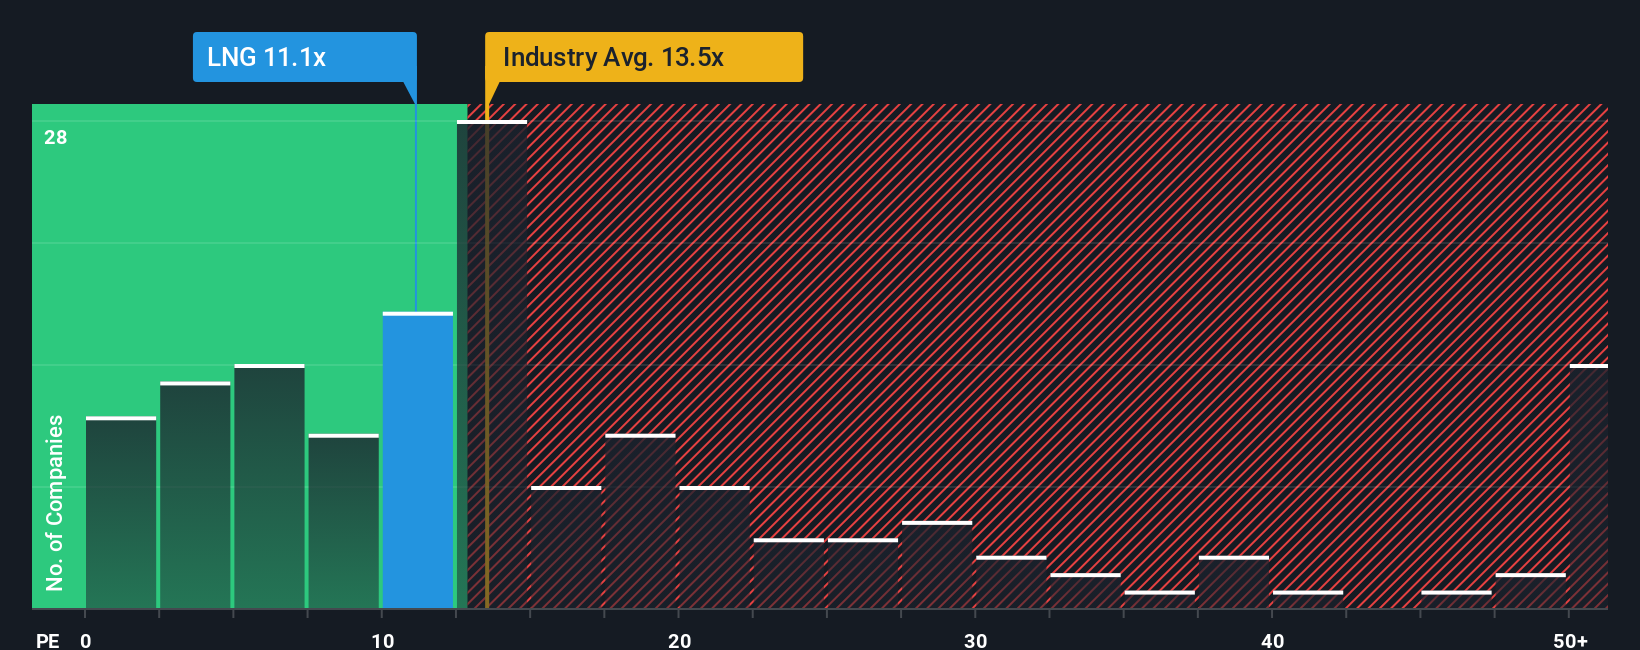 NYSE:LNG P/E Ratio as at Jan 2026
P/E ratios tell one story, but what if the real opportunity lies elsewhere? Discover 1425 companies where insiders are betting big on explosive growth.
Upgrade Your Decision Making: Choose your Cheniere Energy Narrative
Earlier we mentioned that there is an even better way to understand valuation, so let us introduce you to Narratives, a simple way to tell the story behind your numbers for Cheniere Energy and link your view of its future revenue, earnings and margins to a forecast and then to a fair value estimate. On Simply Wall St’s Community page, used by millions of investors, Narratives let you set your assumptions, see the fair value that flows from them, and then compare that fair value to the current share price to help you judge whether Cheniere looks attractive or expensive on your terms. As new information like earnings releases or news is added, Narratives update automatically so your story and fair value stay aligned with the latest data without extra work from you. For example, one Cheniere Narrative might see relatively cautious revenue growth and lower margins that point to a fair value well below the current price. Another might assume stronger LNG demand and higher margins that support a fair value well above where the stock trades today.
Do you think there’s more to the story for Cheniere Energy? Head over to our Community to see what others are saying!
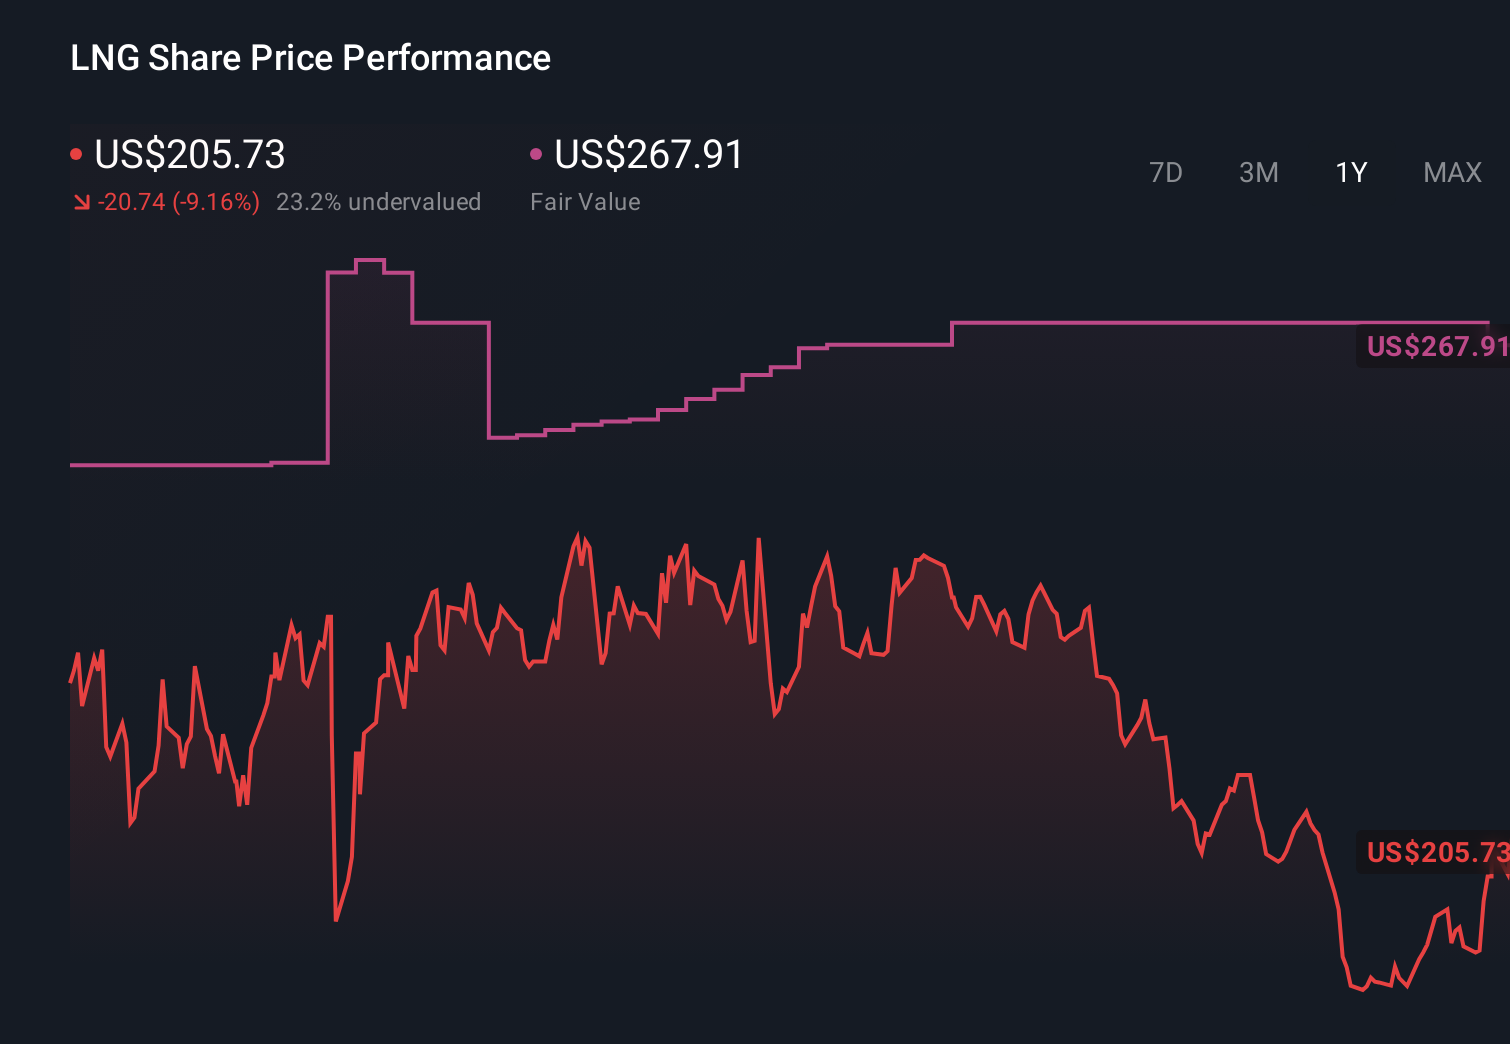 NYSE:LNG 1-Year Stock Price Chart
This article by Simply Wall St is general in nature. We provide commentary based on historical data
and analyst forecasts only using an unbiased methodology and our articles are not intended to be financial advice. It does not constitute a recommendation to buy or sell any stock, and does not take account of your objectives, or your
financial situation. We aim to bring you long-term focused analysis driven by fundamental data.
Note that our analysis may not factor in the latest price-sensitive company announcements or qualitative material.
Simply Wall St has no position in any stocks mentioned.
Our new AI Stock Screener scans the market every day to uncover opportunities.
• Dividend Powerhouses (3%+ Yield)
• Undervalued Small Caps with Insider Buying
• High growth Tech and AI Companies
Or build your own from over 50 metrics.
Have feedback on this article? Concerned about the content? Get in touch with us directly. Alternatively, email editorial-team@simplywallst.com