
Find out why Altria Group’s 29.6% return over the last year is lagging behind its peers.
Approach 1: Altria Group Discounted Cash Flow (DCF) Analysis
A Discounted Cash Flow, or DCF, model projects a company’s future cash flows and discounts them back to today’s value using a required rate of return. The idea is simple: you are asking what all those future cash flows are worth in present dollar terms.
For Altria Group, the model used is a 2 Stage Free Cash Flow to Equity approach. The company’s last twelve months free cash flow is reported at about $9.19b. Simply Wall St shows analyst based and extrapolated free cash flow projections running out to 2035, with forecast cash flows staying in the multi billion dollar range, for example an estimated $8.64b in 2026 and $10.81b in 2035, all in $.
When these projected cash flows are discounted back and summed, the resulting intrinsic value comes out at about $106.01 per share. Compared with the recent share price of $63.62, this implies an intrinsic discount of roughly 40.0%, which suggests the stock screens as materially undervalued on this DCF view.
Result: UNDERVALUED
Our Discounted Cash Flow (DCF) analysis suggests Altria Group is undervalued by 40.0%. Track this in your watchlist or portfolio, or discover 874 more undervalued stocks based on cash flows.
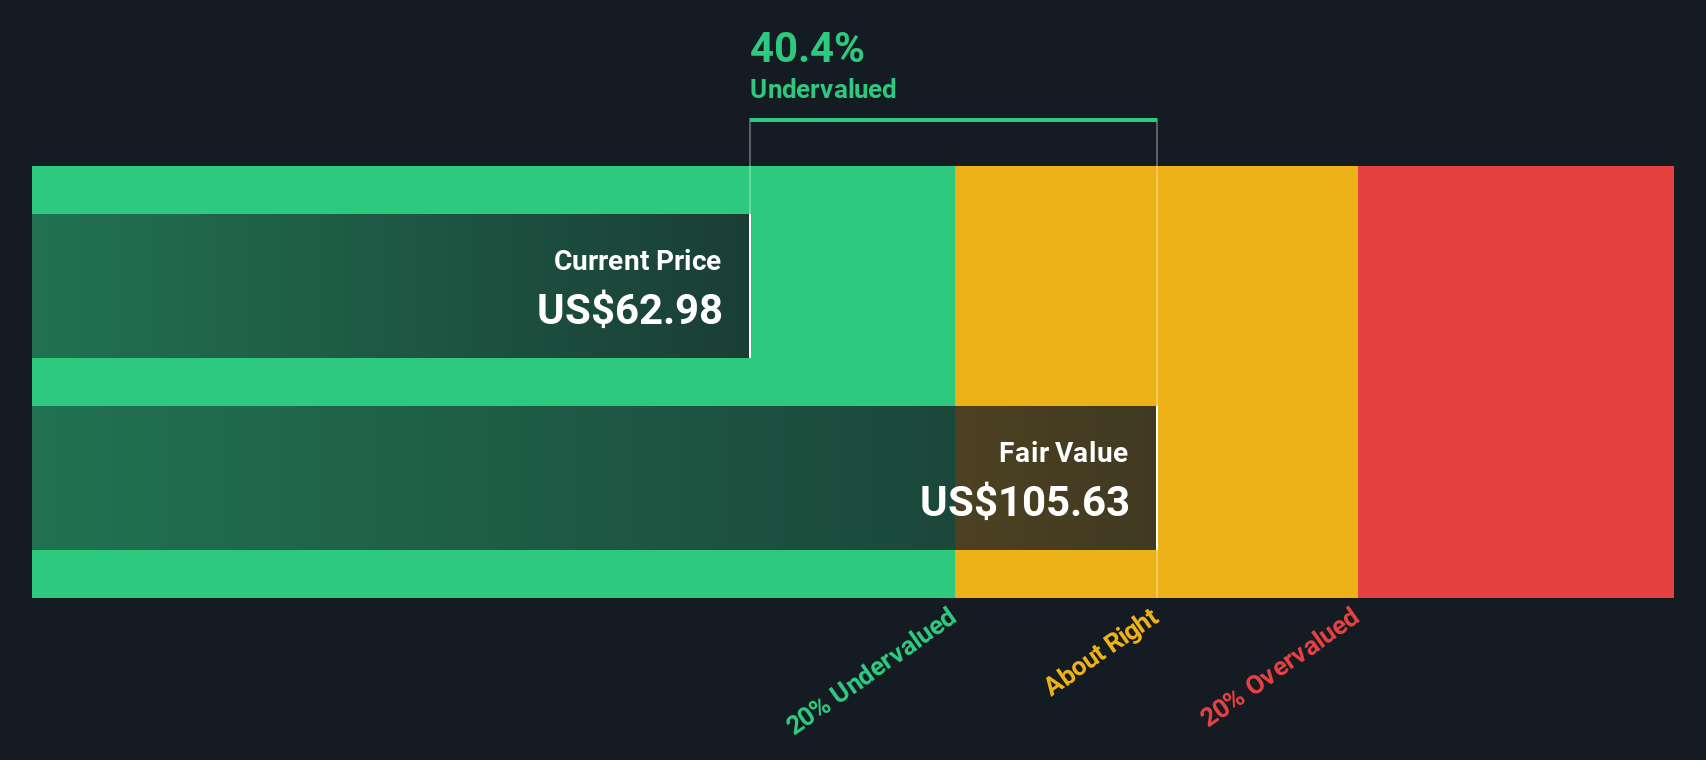 MO Discounted Cash Flow as at Jan 2026
Approach 2: Altria Group Price vs Earnings
For profitable companies like Altria Group, the P/E ratio is a useful shorthand for how much investors are paying for each dollar of earnings. A higher or lower P/E often reflects what the market is willing to pay given expectations for future earnings and the level of risk around those earnings.
Altria Group currently trades on a P/E of 12.08x. That sits close to the Tobacco industry average of 12.98x and well below the broader peer average of 23.98x. On the surface, that might suggest a more conservative valuation compared with many peers, while still roughly in line with the sector it operates in.
Simply Wall St also estimates a proprietary “Fair Ratio” for the stock, which is 18.74x. This Fair Ratio is designed to reflect the P/E you might expect given factors such as earnings growth, profit margins, industry, market cap and specific risks, rather than relying only on simple peer or industry comparisons. Because it folds these variables into a single number, it can give a more tailored view of what looks reasonable for this particular company. Compared with the actual P/E of 12.08x, the Fair Ratio of 18.74x suggests that Altria Group screens as undervalued on this metric.
Result: UNDERVALUED
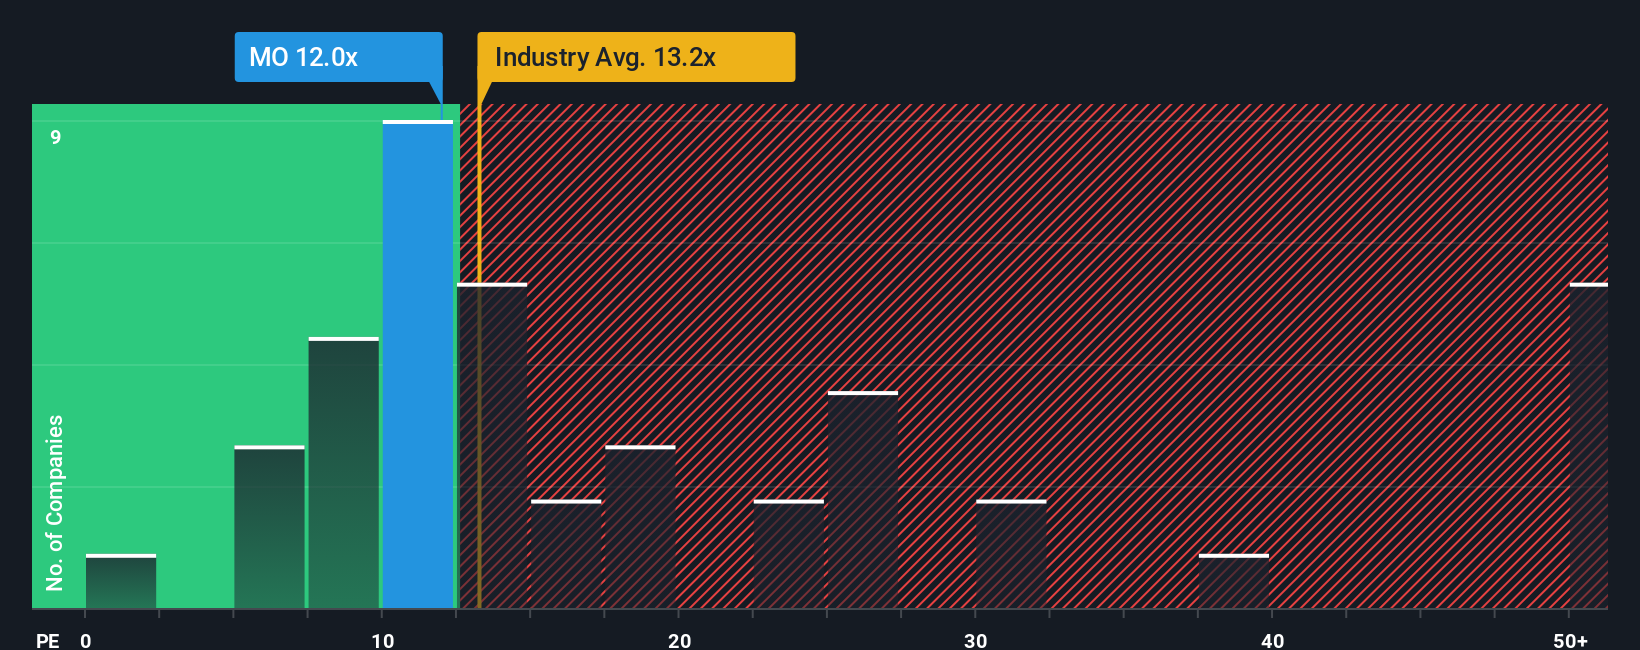 NYSE:MO P/E Ratio as at Jan 2026
P/E ratios tell one story, but what if the real opportunity lies elsewhere? Discover 1420 companies where insiders are betting big on explosive growth.
Upgrade Your Decision Making: Choose your Altria Group Narrative
Earlier we mentioned that there is an even better way to understand valuation, so let us introduce you to Narratives, which give you a clear story behind the numbers you see for Altria Group.
A Narrative is simply your view of the company, where you spell out what you think happens to its revenue, earnings and margins, then connect that view to a financial forecast and finally to a fair value estimate. On Simply Wall St, within the Community page used by millions of investors, Narratives turn this into an easy tool that lets you compare your Fair Value with the current share price. This can help you decide whether a stock looks attractive or expensive to you, without needing complex models. Narratives also update when new information arrives like earnings releases or important news. This way, your fair value view stays in sync with the latest data instead of going stale. For example, one Altria Group Narrative might assume a higher fair value based on confidence in reduced risk products, while another might set a lower fair value because it places more weight on long term regulatory pressure.
Do you think there’s more to the story for Altria Group? Head over to our Community to see what others are saying!
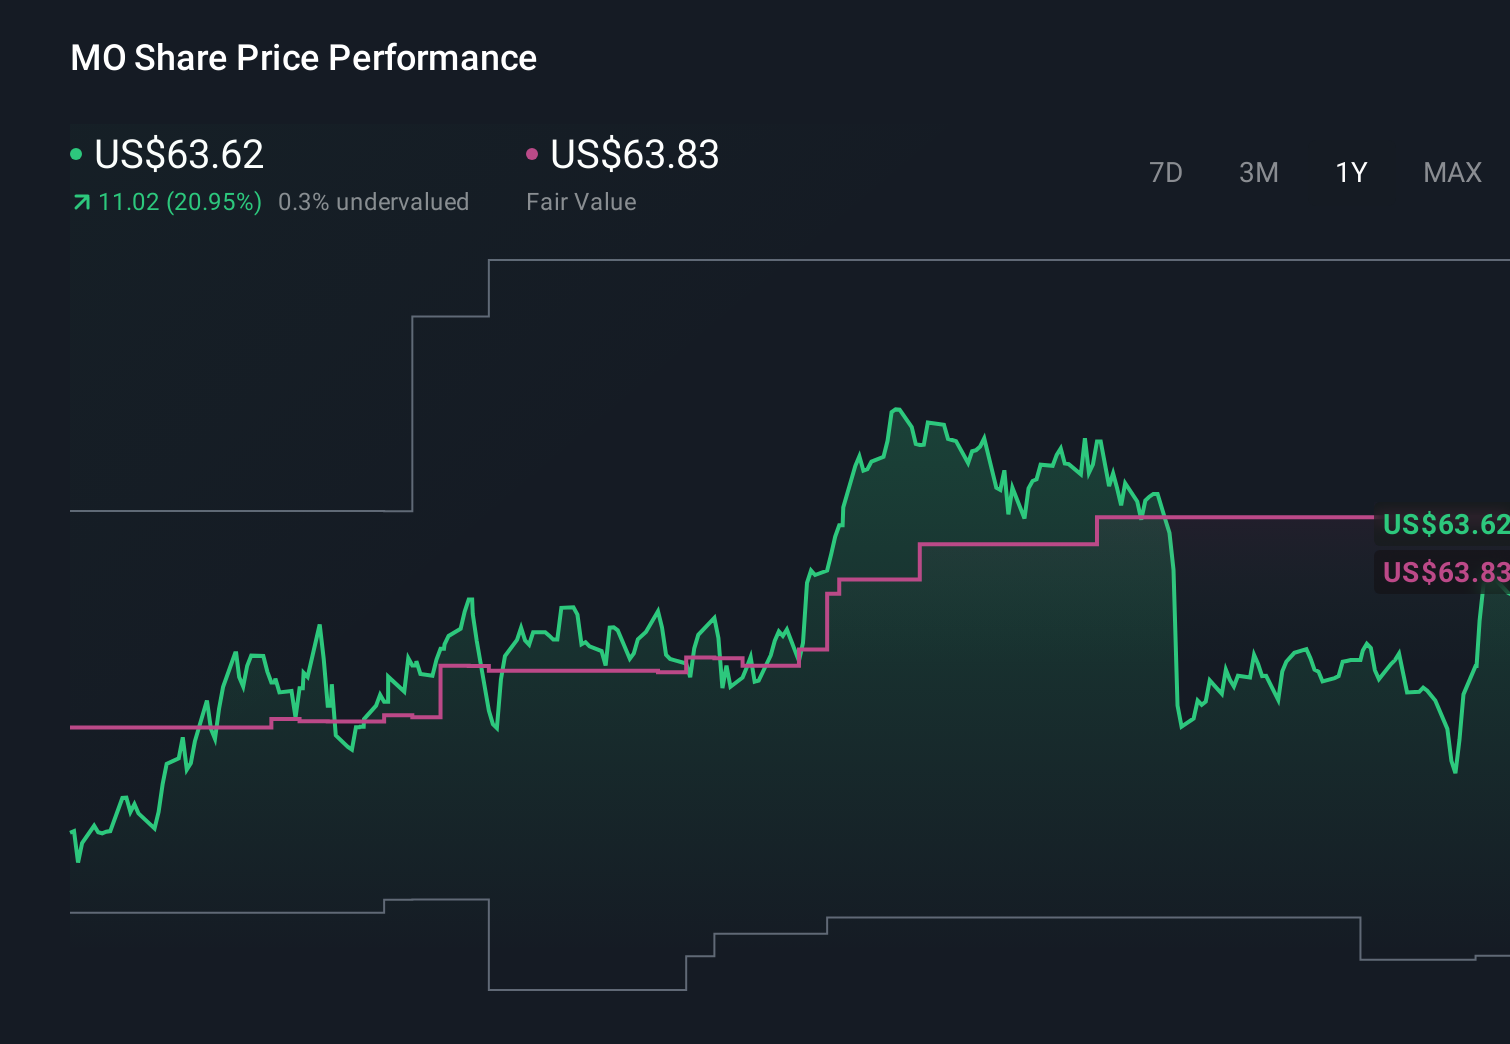 NYSE:MO 1-Year Stock Price Chart
This article by Simply Wall St is general in nature. We provide commentary based on historical data
and analyst forecasts only using an unbiased methodology and our articles are not intended to be financial advice. It does not constitute a recommendation to buy or sell any stock, and does not take account of your objectives, or your
financial situation. We aim to bring you long-term focused analysis driven by fundamental data.
Note that our analysis may not factor in the latest price-sensitive company announcements or qualitative material.
Simply Wall St has no position in any stocks mentioned.
We’ve created the ultimate portfolio companion for stock investors, and it’s free.
• Connect an unlimited number of Portfolios and see your total in one currency
• Be alerted to new Warning Signs or Risks via email or mobile
• Track the Fair Value of your stocks
Have feedback on this article? Concerned about the content? Get in touch with us directly. Alternatively, email editorial-team@simplywallst.com